UI
A page-by-page walk through the Pacer operator console: what each view shows, when you'd open it, and where the data comes from.
The Pacer console is a Svelte SPA served by the same Go binary that runs the orchestrator. Two top-level groups in the sidebar:
- Control — read-only observation.
Overview,Jobs,Stats,Audit. - Config — state-changing edits.
Projects,Repos,Pools,Backup,Settings.
Screenshots below were captured against a development database with synthetic data (3 projects, 5 pools, 4 repos, ~80 jobs spanning every status). Real deployments will look the same — just with your data.
Health banner
Every page reserves a slot above the content for a red system health banner. When the background reaper or the startup IAM preflight reports a problem (missing ec2:DescribeInstances, a recovered panic, a DescribeInstances API error), the banner shows the failing component + the reason. The banner self-clears once the next clean reaper tick (≤60 s) succeeds. The banner polls /api/health every 30 s.
Sign in
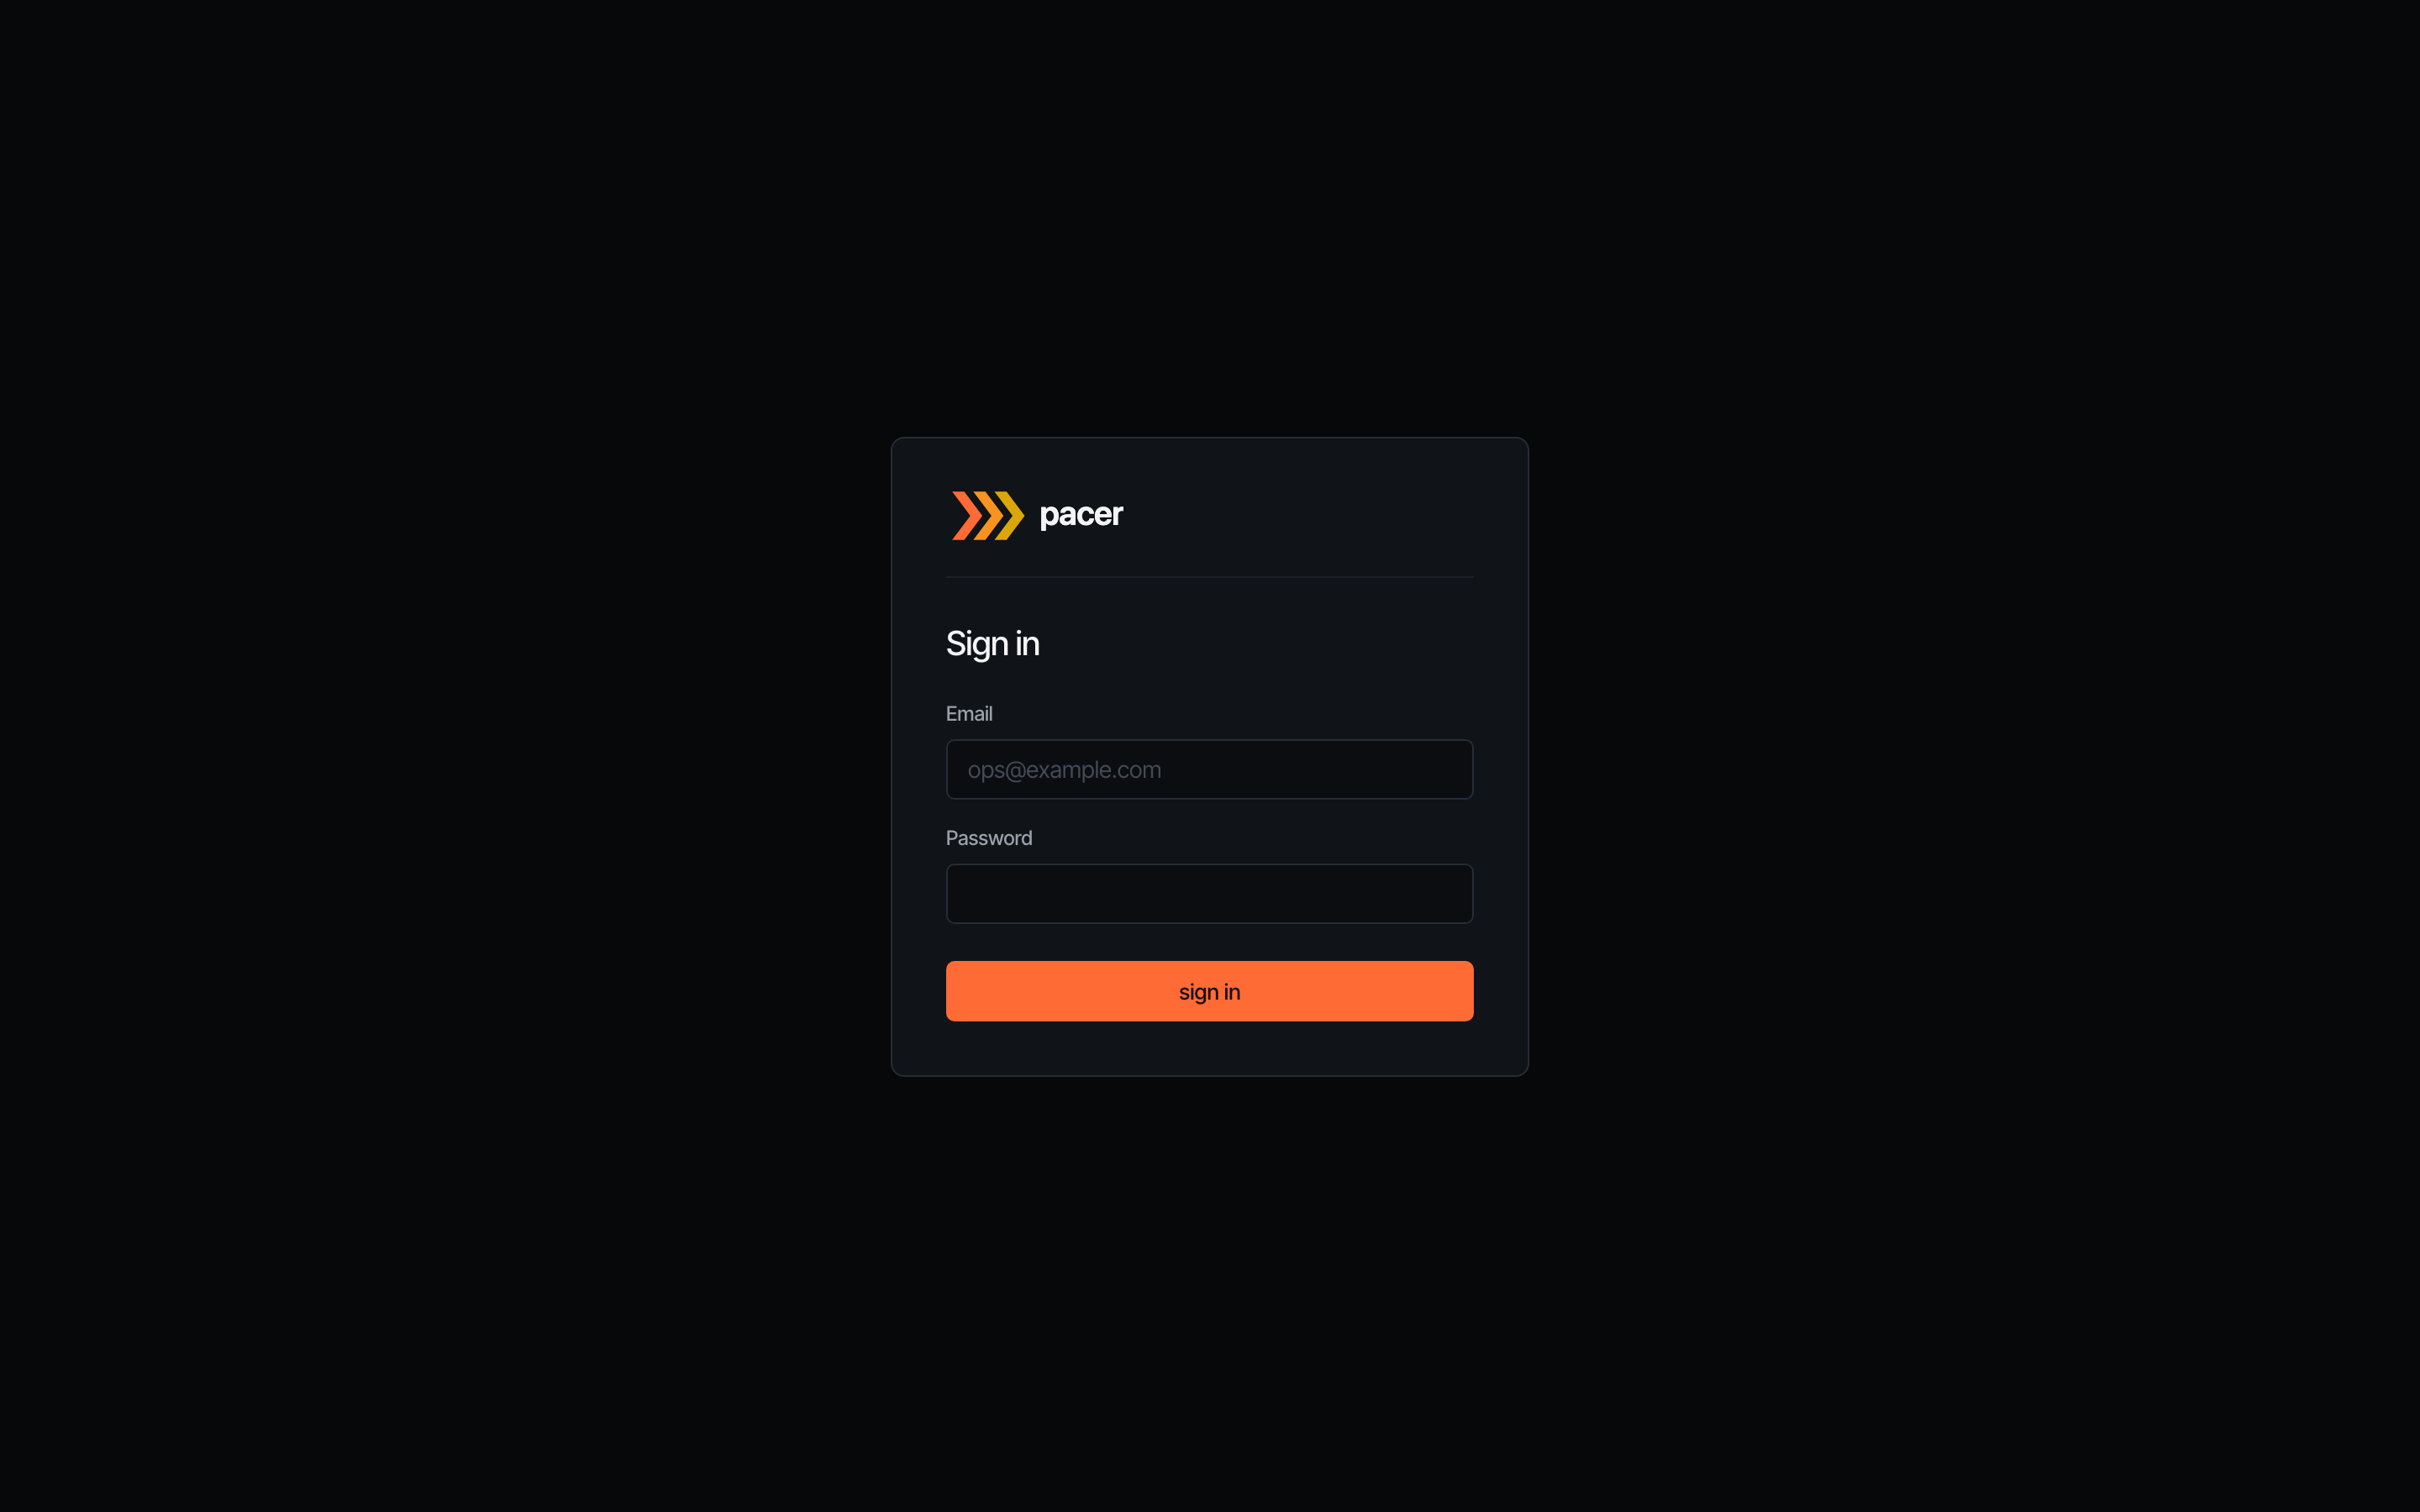
The login screen is the first thing operators see when auth.disabled: false. Local sign-in uses the bootstrap email + the random password Pacer logs once to stderr on first start. If auth.oidc.enabled: true, an additional Sign in with SSO button appears above the divider.
The page disappears entirely when auth.disabled: true — the layout detects the flag and routes everything to the dashboard. Useful for private-network deployments behind a reverse proxy that already authenticates.
Overview
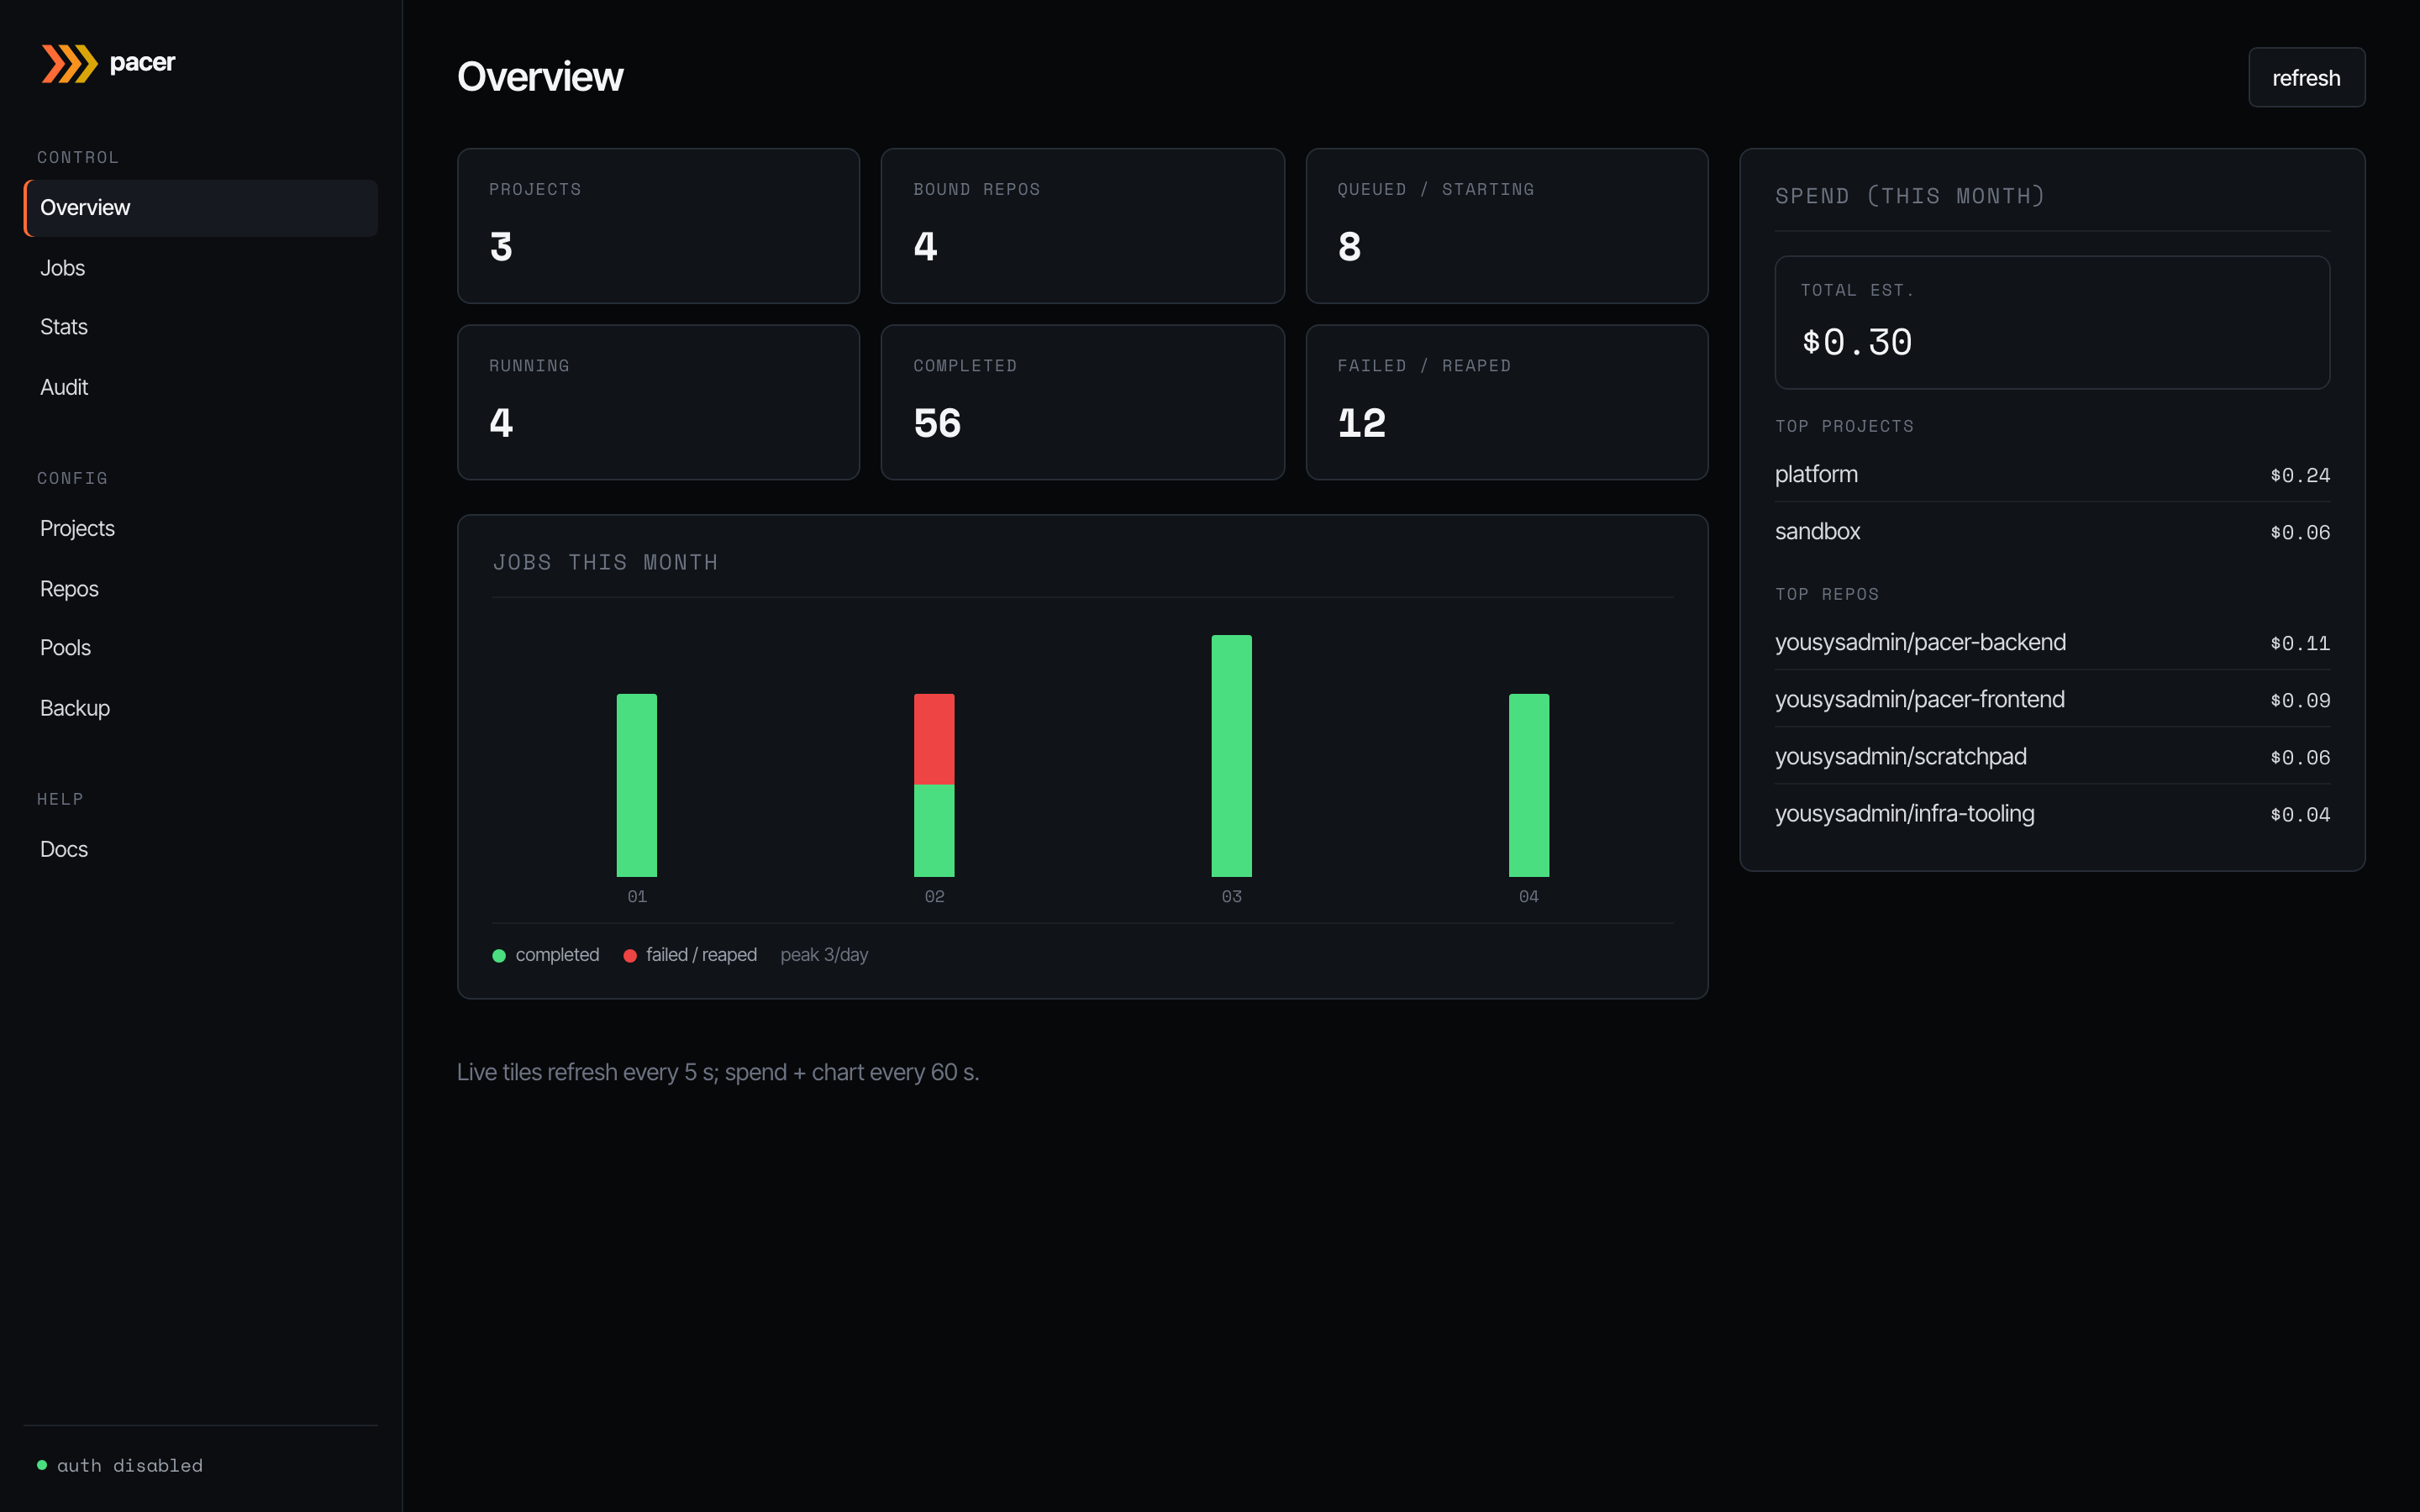
The dashboard. Live tiles on the left refresh every 5 s and summarise the current pool state: how many projects you’ve configured, repos bound, jobs queued or starting, jobs running, and how many ended in completed vs failed/reaped over the visible window.
The bar chart underneath plots completed (green) and failed/reaped (red) jobs day-by-day for the current month. The right-hand spend card refreshes every 60 s and ranks the top projects and repos by estimated spend (launch-time on-demand price × elapsed run time). Sub-cent runs are formatted with four decimals so they don’t round to $0.00.
Jobs
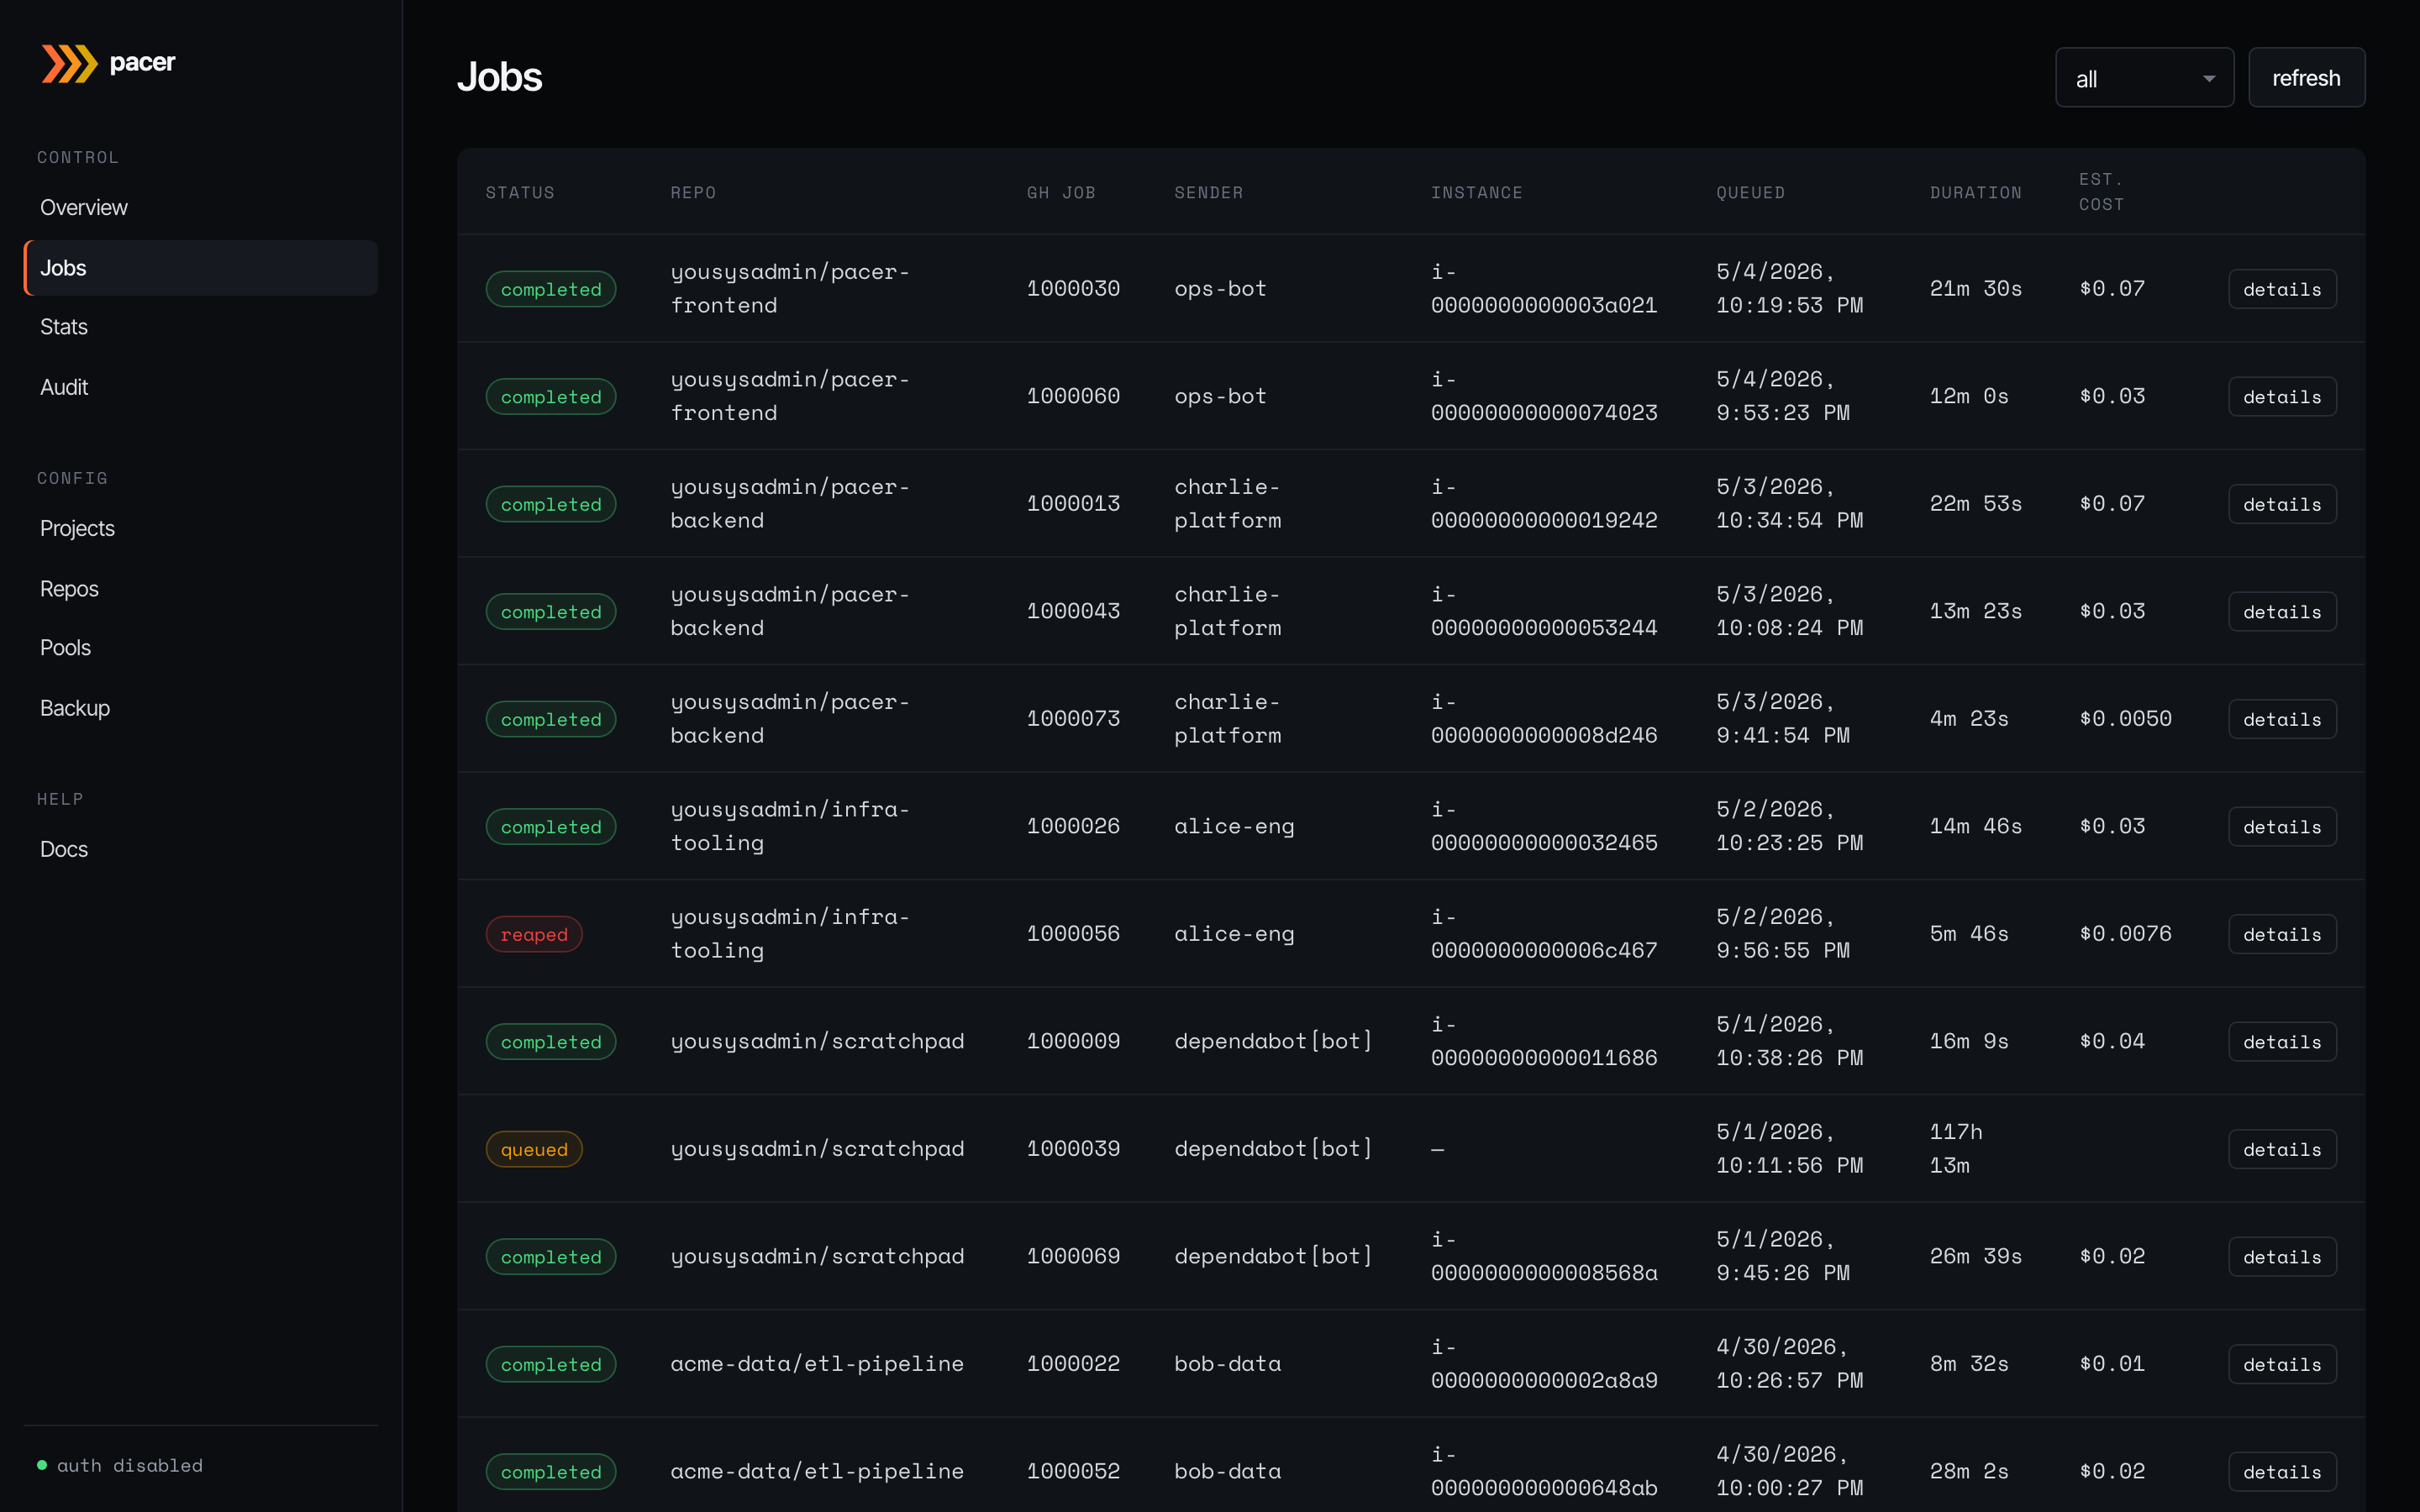
Every webhook Pacer has accepted, newest first. Status is colour-coded: queued (amber), claimed/starting/running (blue/info), completed (green), failed/reaped (red). Columns show the bound repo, GitHub job ID, sender (the GitHub user or bot that triggered the workflow), the EC2 instance ID Pacer placed the job on, the queue/launch timestamps, run duration, and the estimated cost.
The status dropdown filters by job state. A per-page dropdown (25 / 50 / 100 / 250) sets the page size; a pager at the bottom of the table carries first / prev / next controls plus a Showing X-Y of Z counter. The toolbar also has:
- first — jump to page 1 (shortcut for “show me the latest”).
- refresh — re-fetch from page 1. Equivalent to first + a forced reload; with auto-refresh paused past page 1, this is how operators return to the live view.
- reconcile now — forces an immediate reaper sweep so an instance terminated directly in the AWS console is reconciled within one round trip instead of waiting up to 60 s for the next tick. Useful for debugging stuck rows.
Auto-refresh runs every 5 s on page 1. It pauses automatically when the operator pages past 1, so historical pages stay stable while you read them — click first or refresh to resume.
The details button on each row opens the full timeline modal:
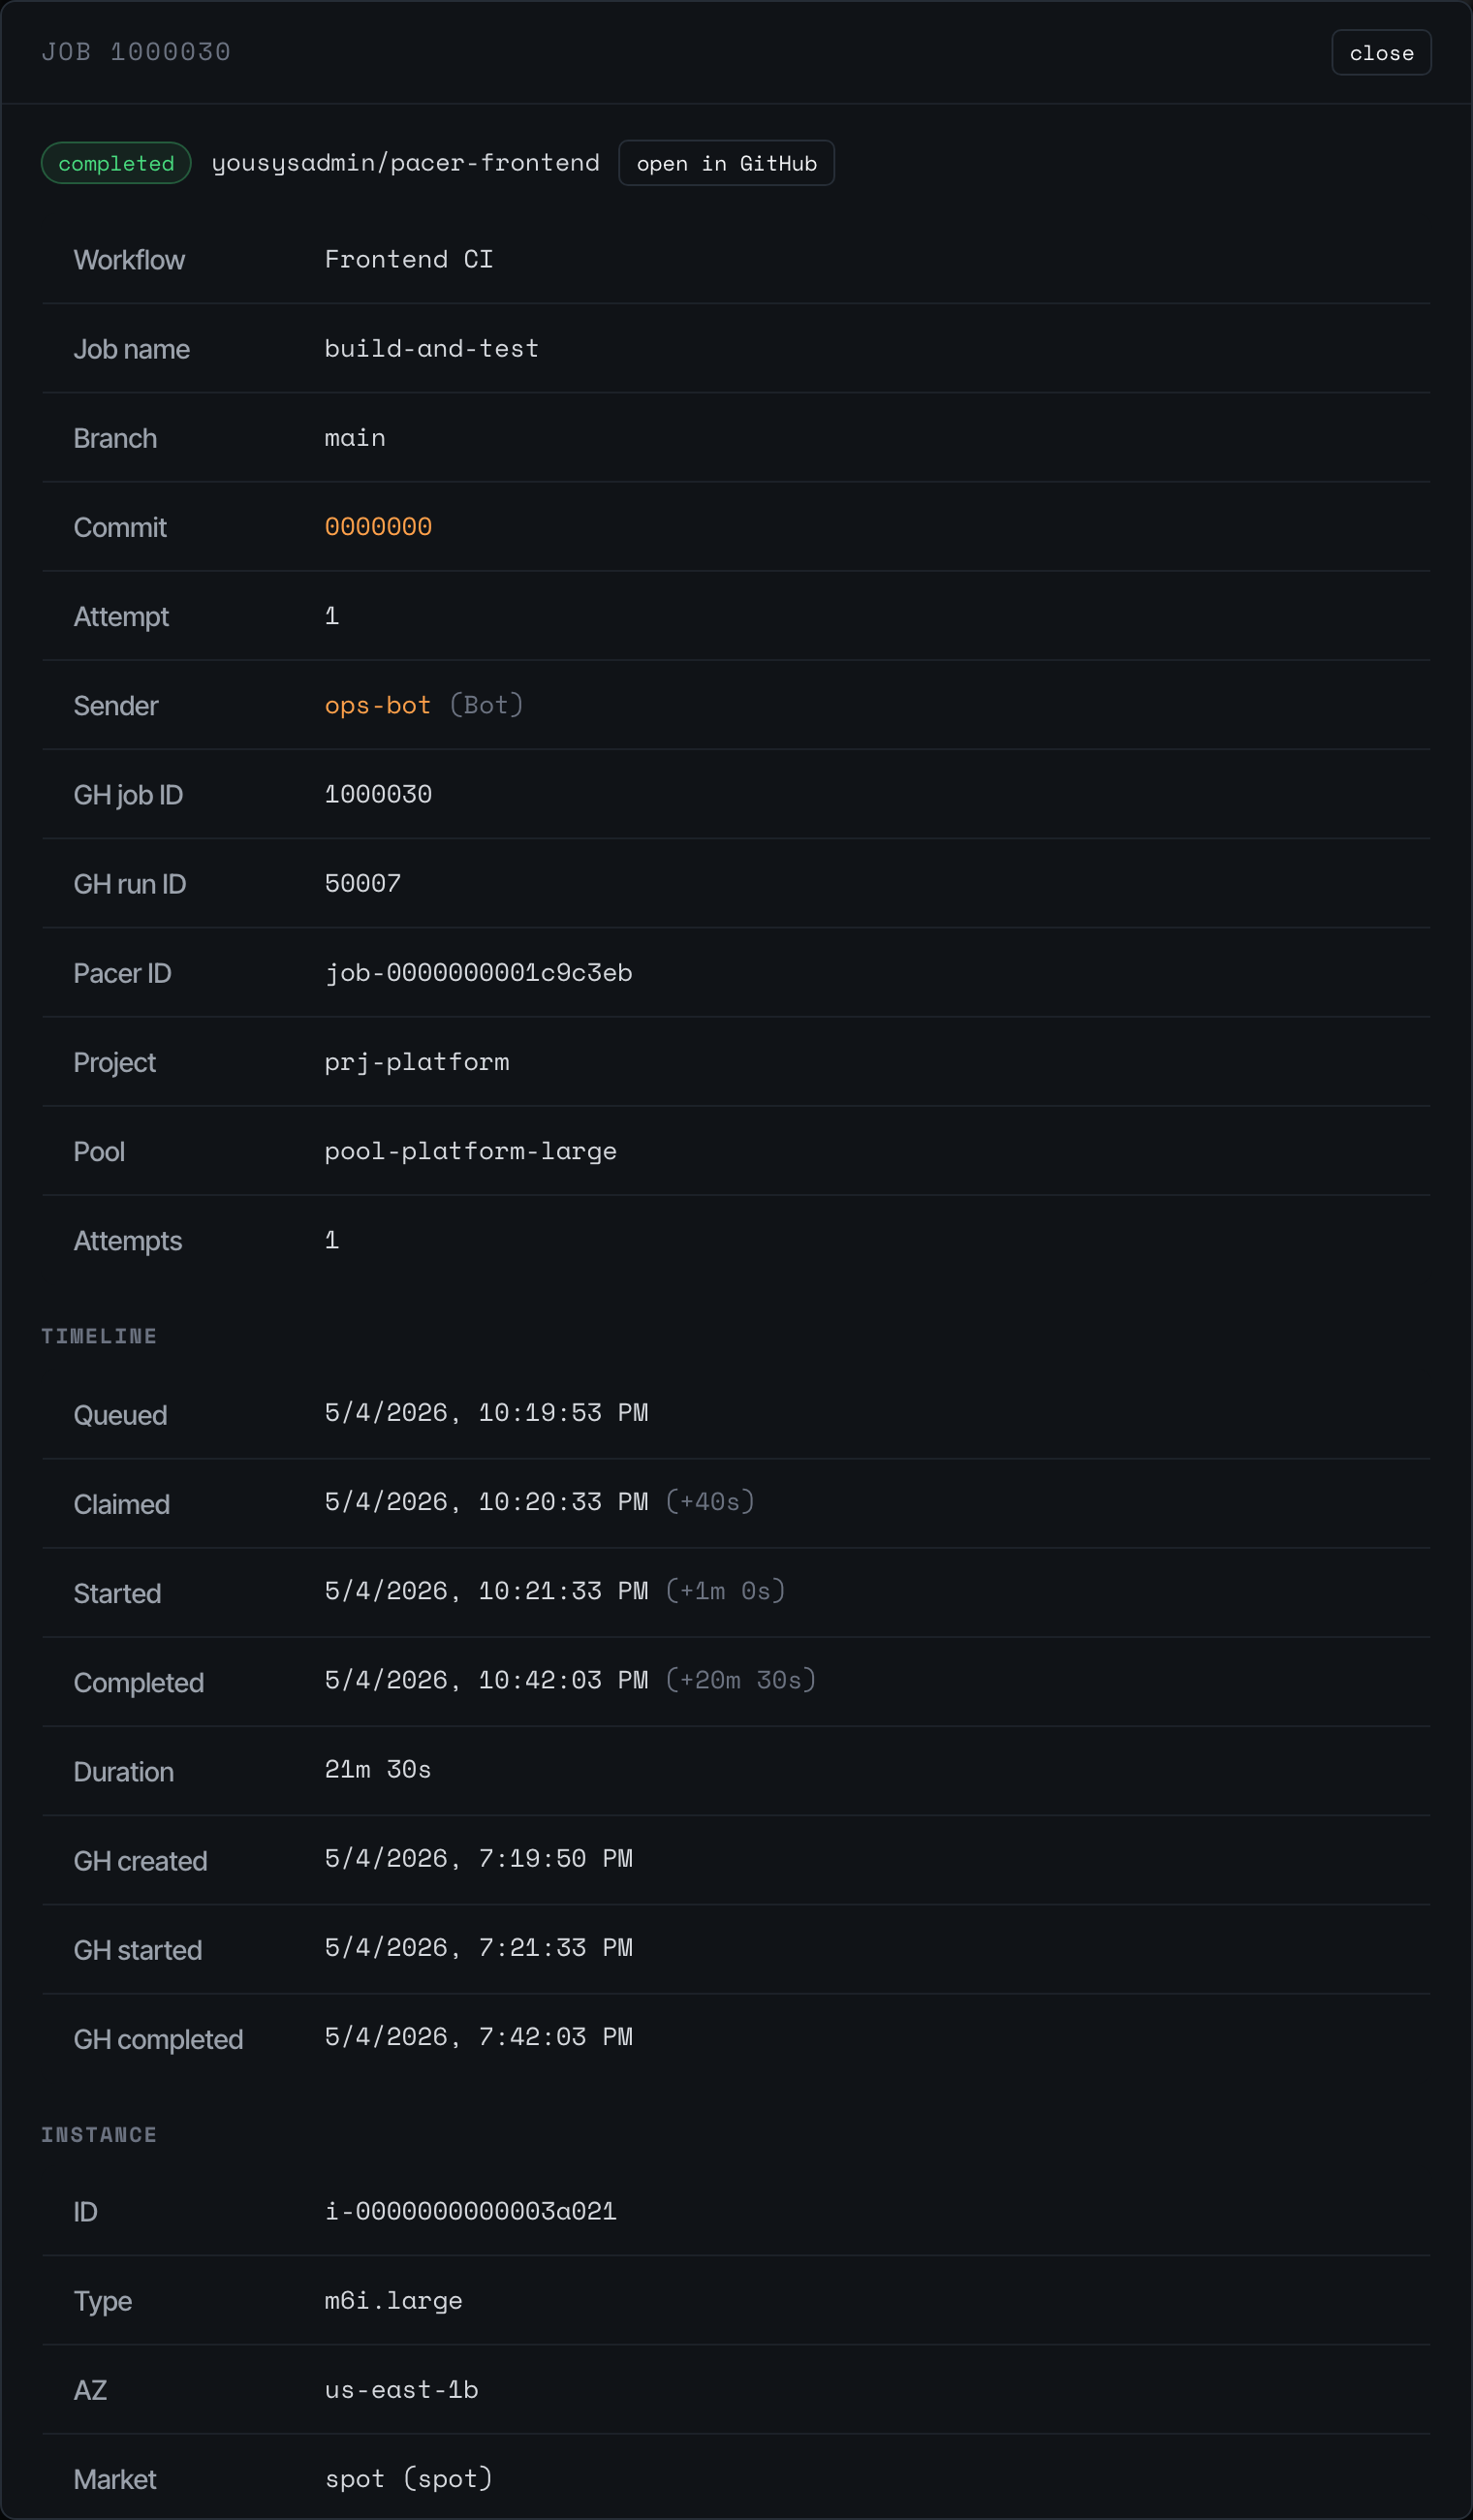
The detail modal shows everything Pacer knows about a single job: workflow + branch + commit, the GitHub job/run IDs, the project and pool that picked it up, the number of attempts, a timeline of state transitions (queued -> claimed -> running -> completed), and the linked EC2 instance. The instance block includes a Last seen badge — the reaper stamps the row’s last_seen_at on every successful DescribeInstances pass, so a green badge means “reaper is actively visiting this row” (< 90 s), amber means “one tick missed” (< 3 min), and red means “multiple ticks missed — something is wrong” (>= 3 min). The badge only colours in-flight states; terminated rows just show the final stamp time.
Click open in GitHub to jump to the run on github.com.
Stats
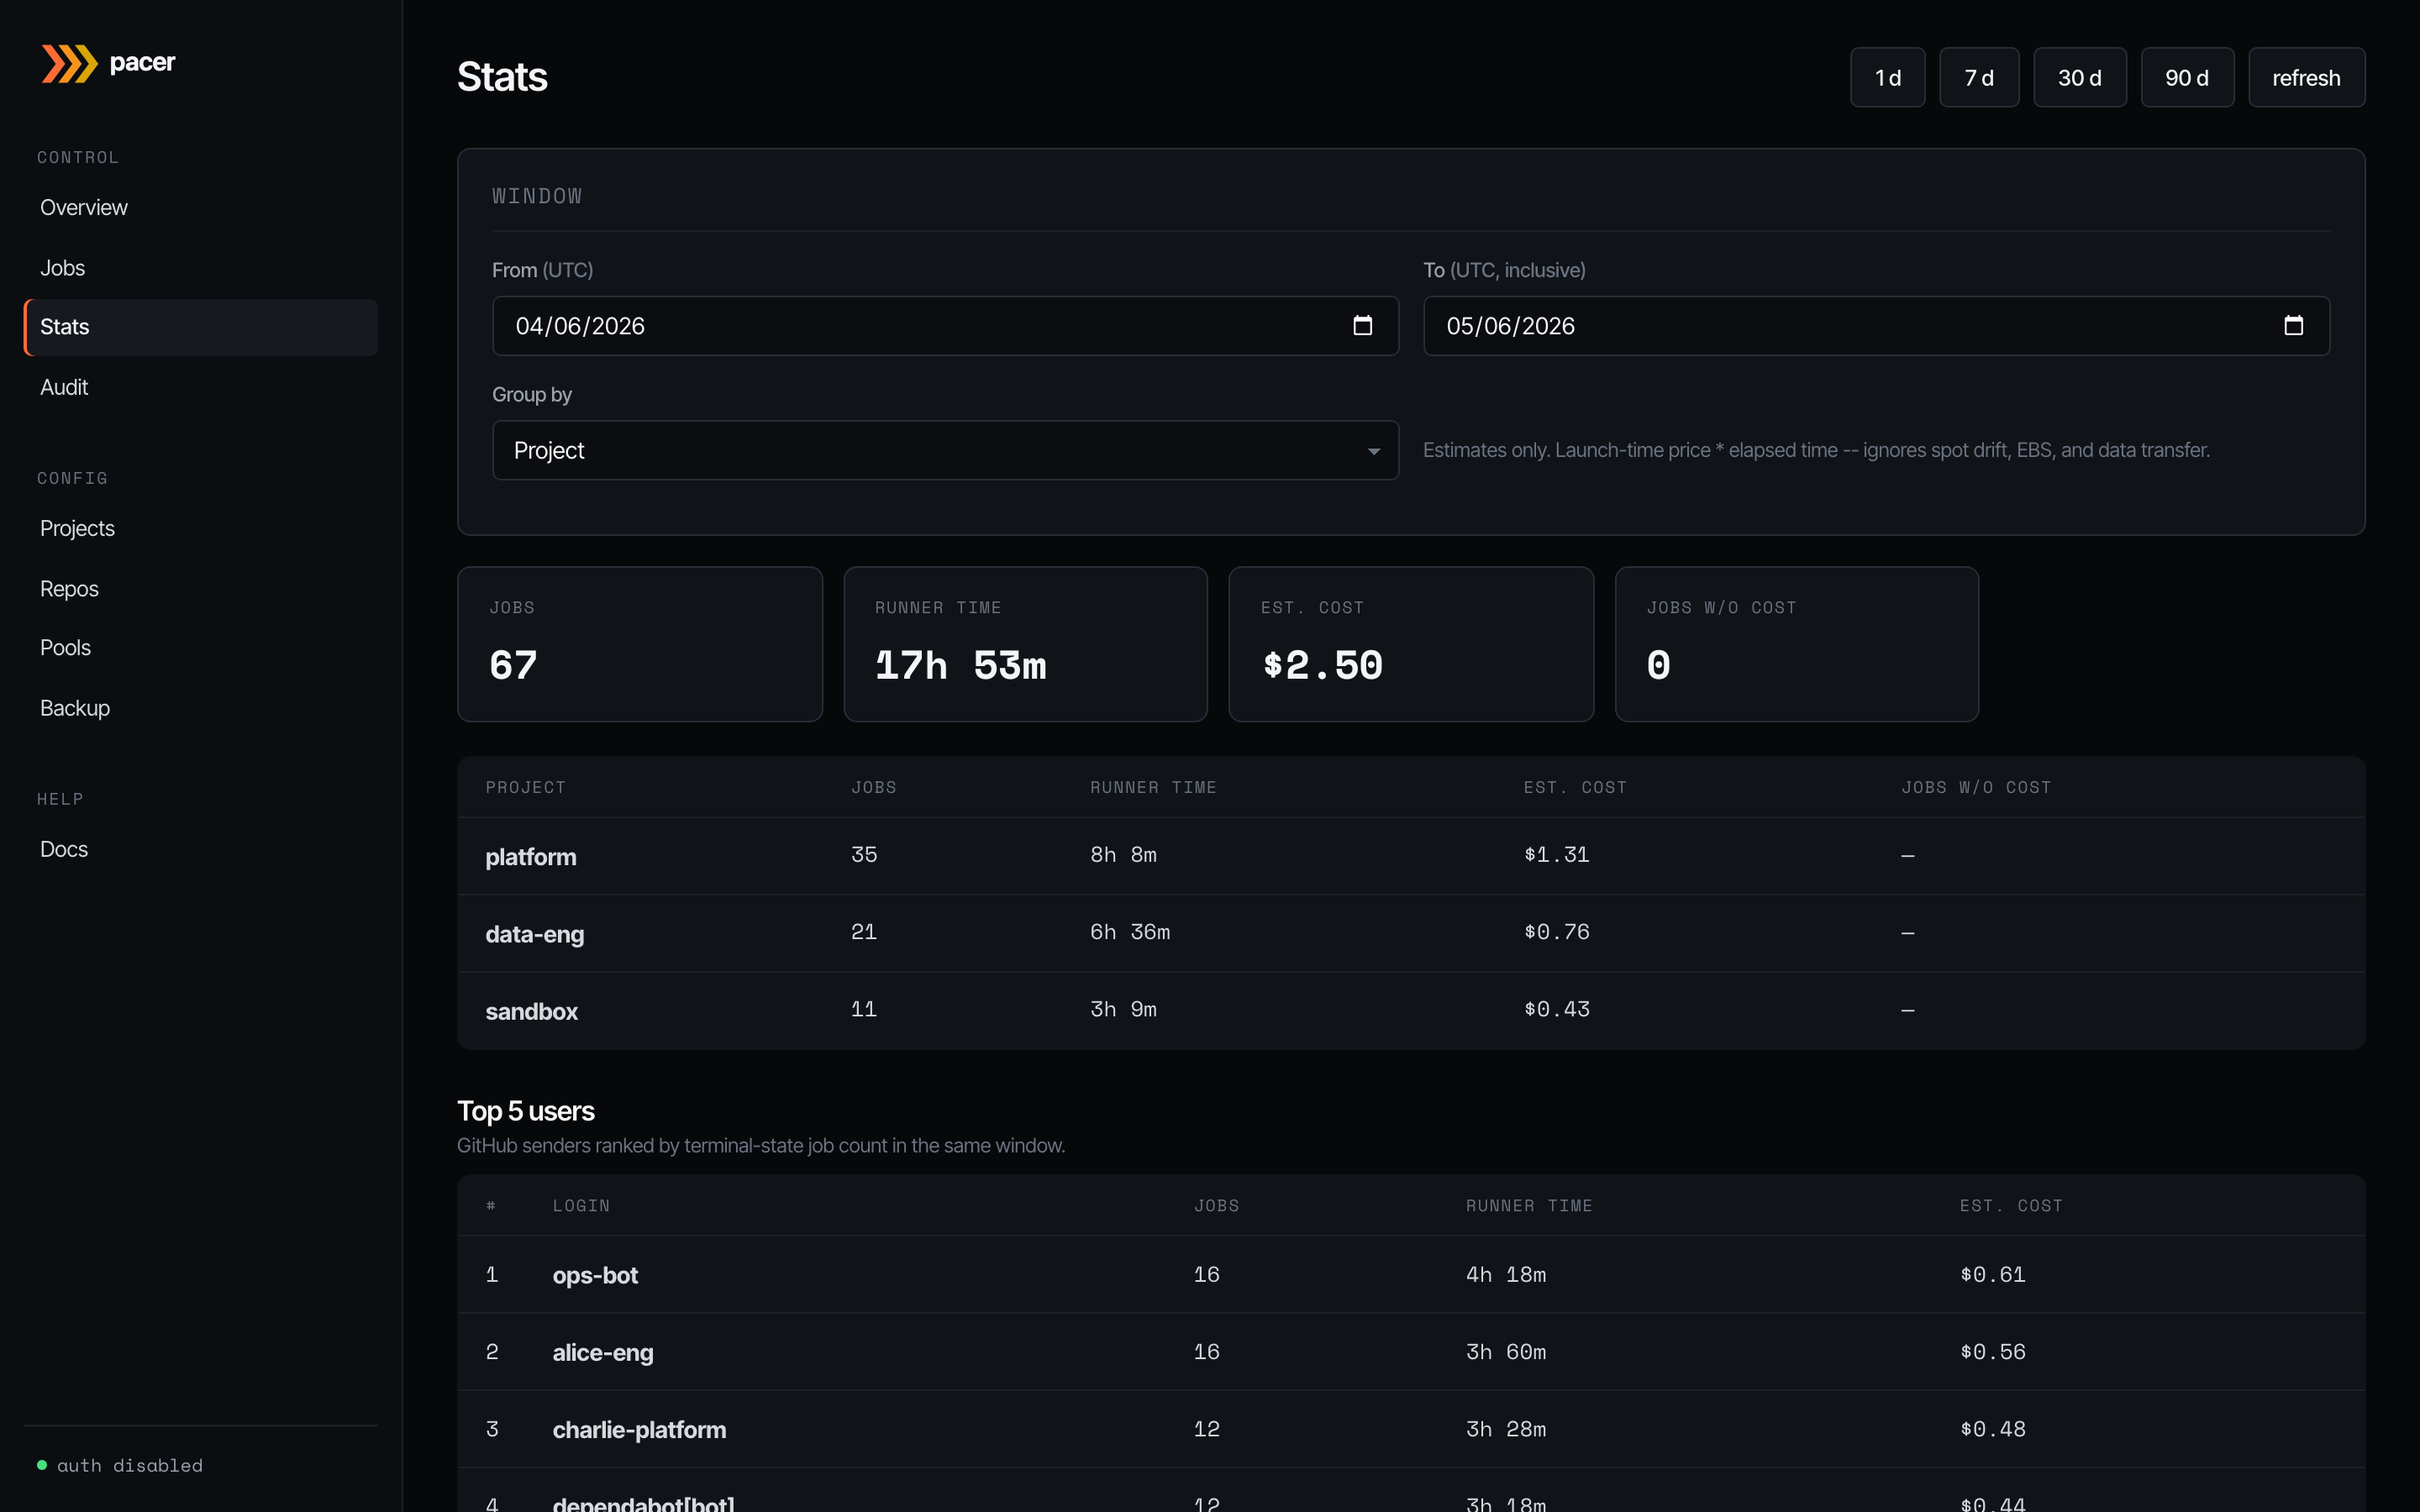
Roll-ups over a configurable window (1 d / 7 d / 30 d / 90 d, or a custom range). Group by project, pool, repo, or runner label. Tiles up top show jobs run, total runner time, estimated cost, and how many jobs lacked a price quote at spawn time (those contribute zero to the cost total — the headline is a floor, not a final answer).
The lower table breaks the window down by your chosen group; below that, Top 5 users ranks GitHub senders by terminal-state job count in the same window. Useful for capacity planning and chargeback conversations.
Audit
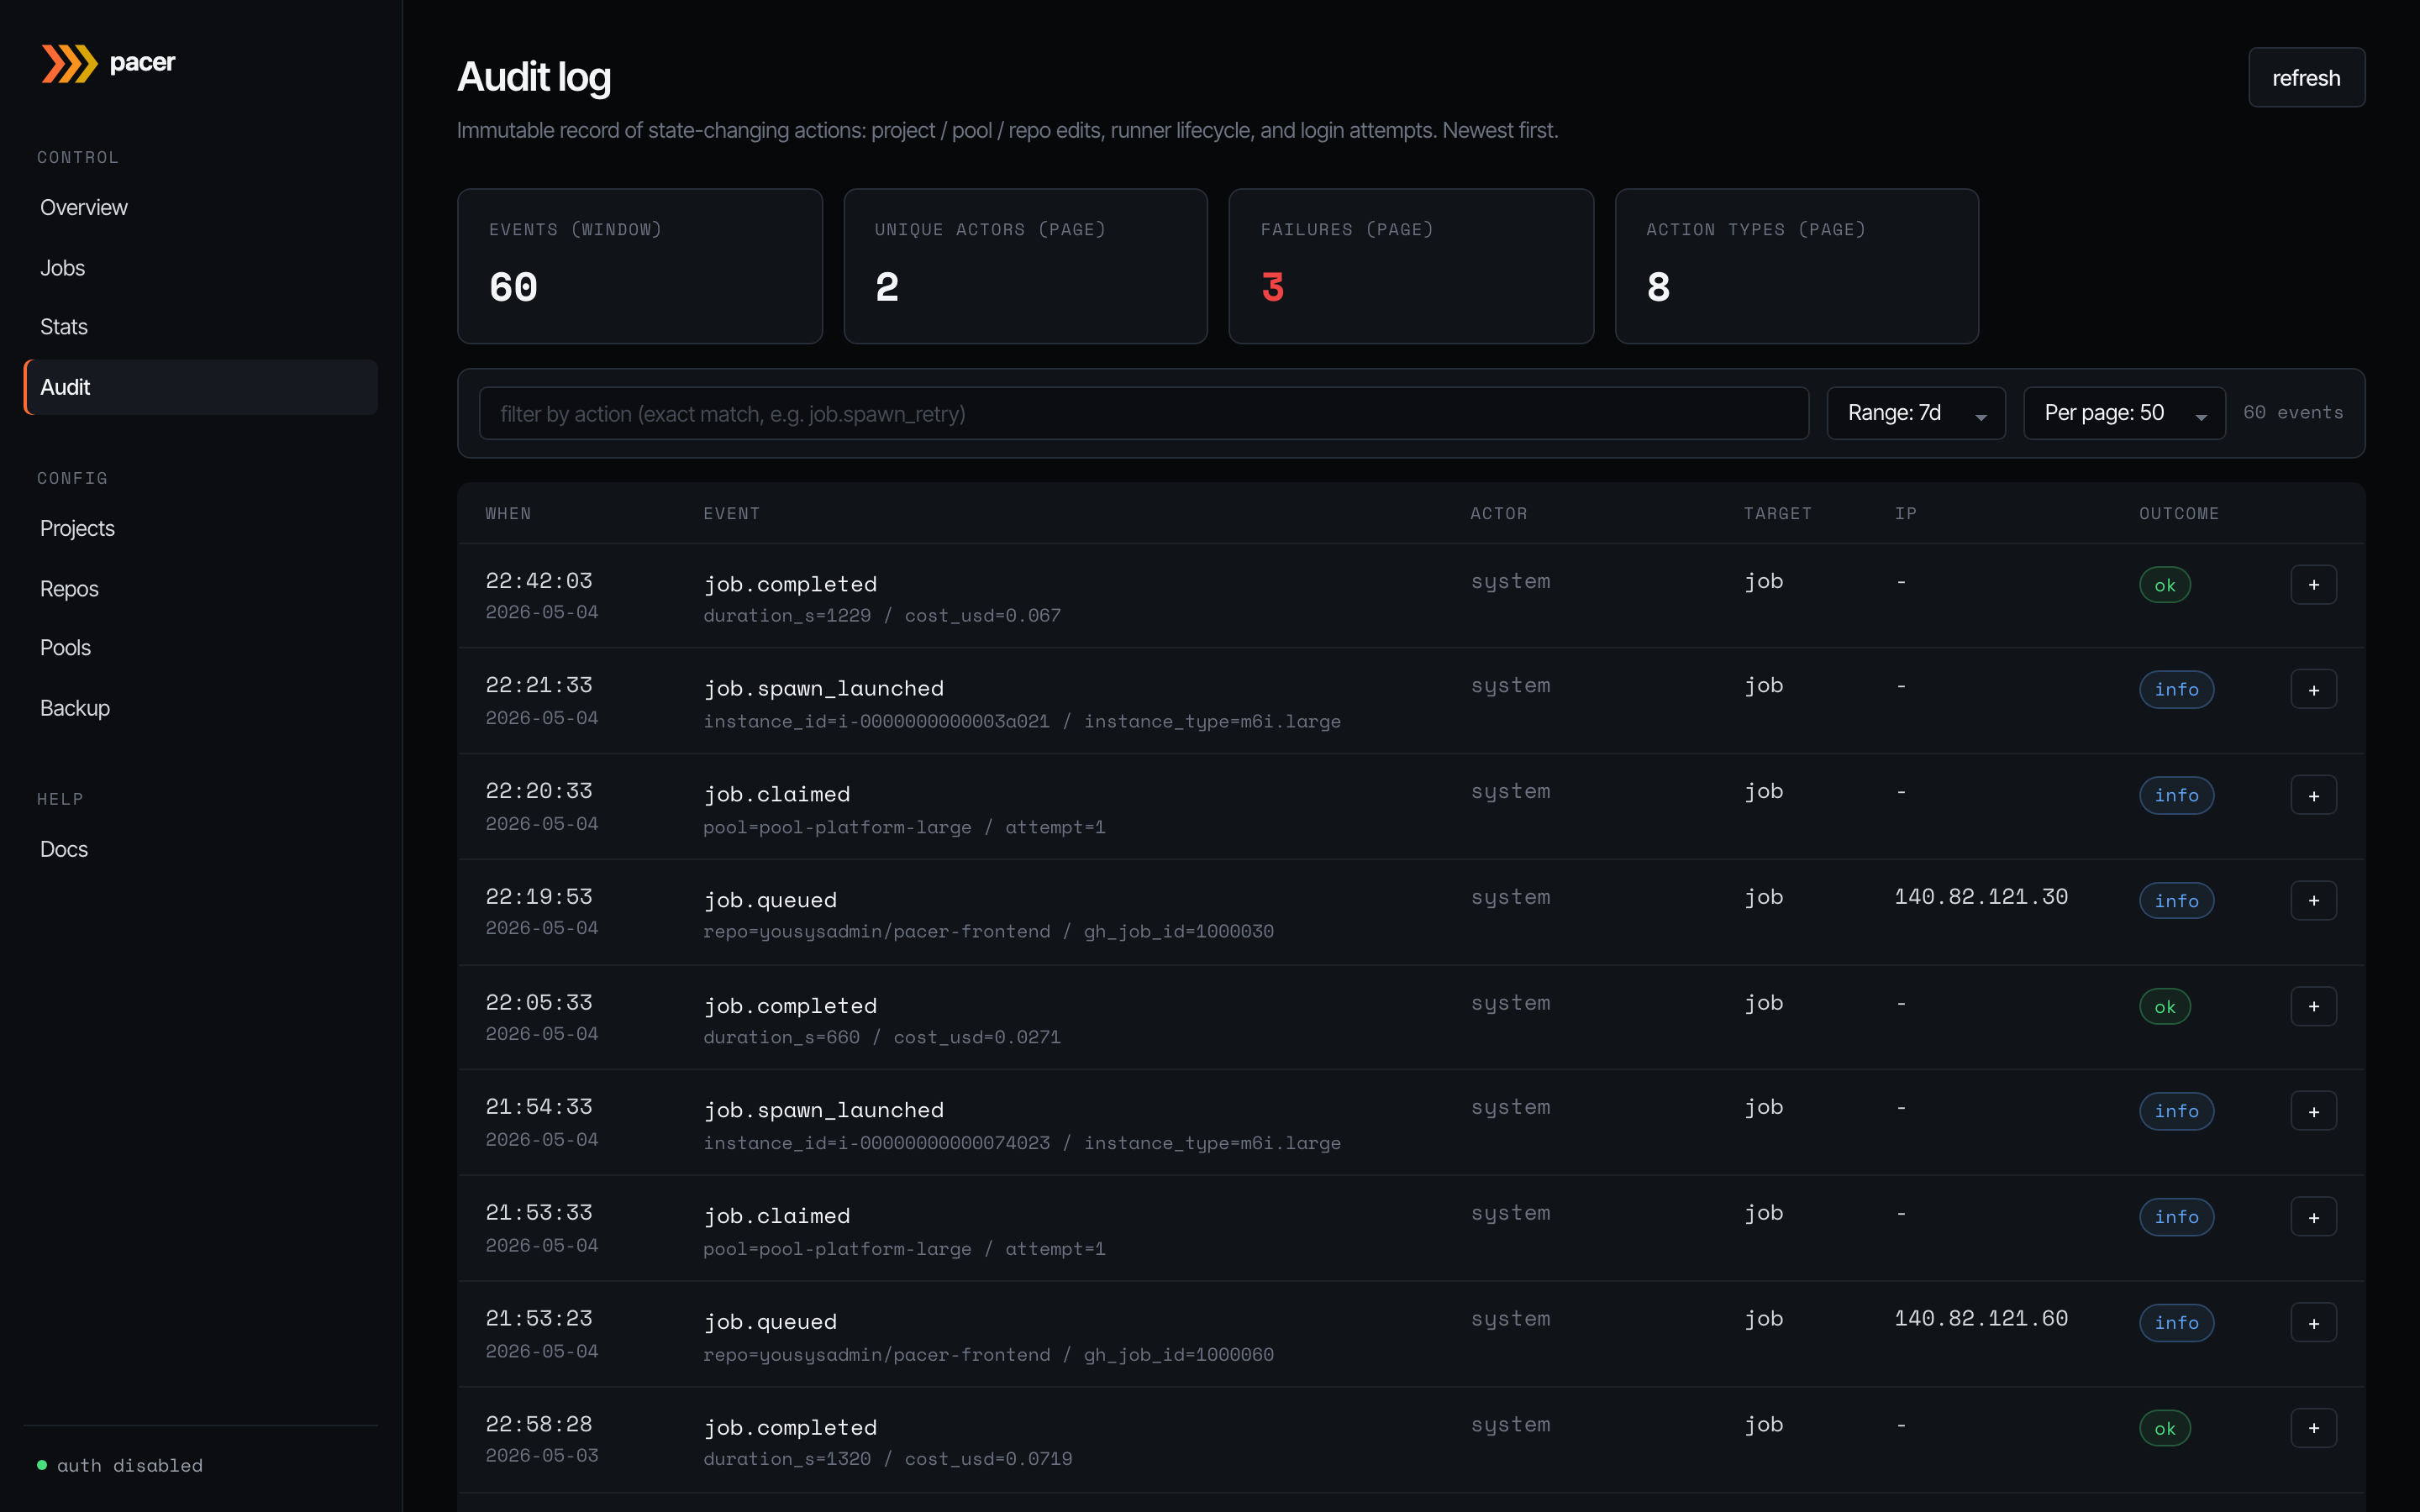
Immutable record of state-changing actions: project / pool / repo edits, runner lifecycle transitions (job.queued, job.claimed, job.spawn_launched, job.completed, …), and login attempts. Newest first.
Search and filter
The first input in the toolbar is a free-text search that hits every column an operator might know a clue for: target_id (instance ID, job ID, pool/project UUID), the detail JSON blob (instance IDs, pool names, AWS state reasons), client_ip, actor_email, request_id, and action. Paste any of those — i-0abc..., 203.0.113.42, req-abcdef, an email, or job.failed — and matching rows surface. The search is debounced (300 ms) and case-insensitive, LIKE meta-characters (%, _) are escaped so they match literally. The second input is a strict-equality action filter for power users who know the exact action name. The time-range and page-size controls round out the toolbar.
Manual prune
Above the table, the Prune entries older than [period] [prune] control deletes rows older than the selected window (1 / 7 / 15 / 30 / 90 / 180 days / 1 / 2 years). The button confirms with the absolute cutoff date and then deletes; the prune itself is recorded as an audit.pruned row (which by definition lands after its own cutoff and so survives).
A scheduled auto-prune runs daily, governed by retention.audit_days (default 90 days) — see Settings.
Detail panel
The info badge on each row opens a side panel with the full event payload — useful when the headline cell can’t fit the entire context (instance type, attempt count, error reason). Failures within the visible page are counted in the stat tile up top.
Projects
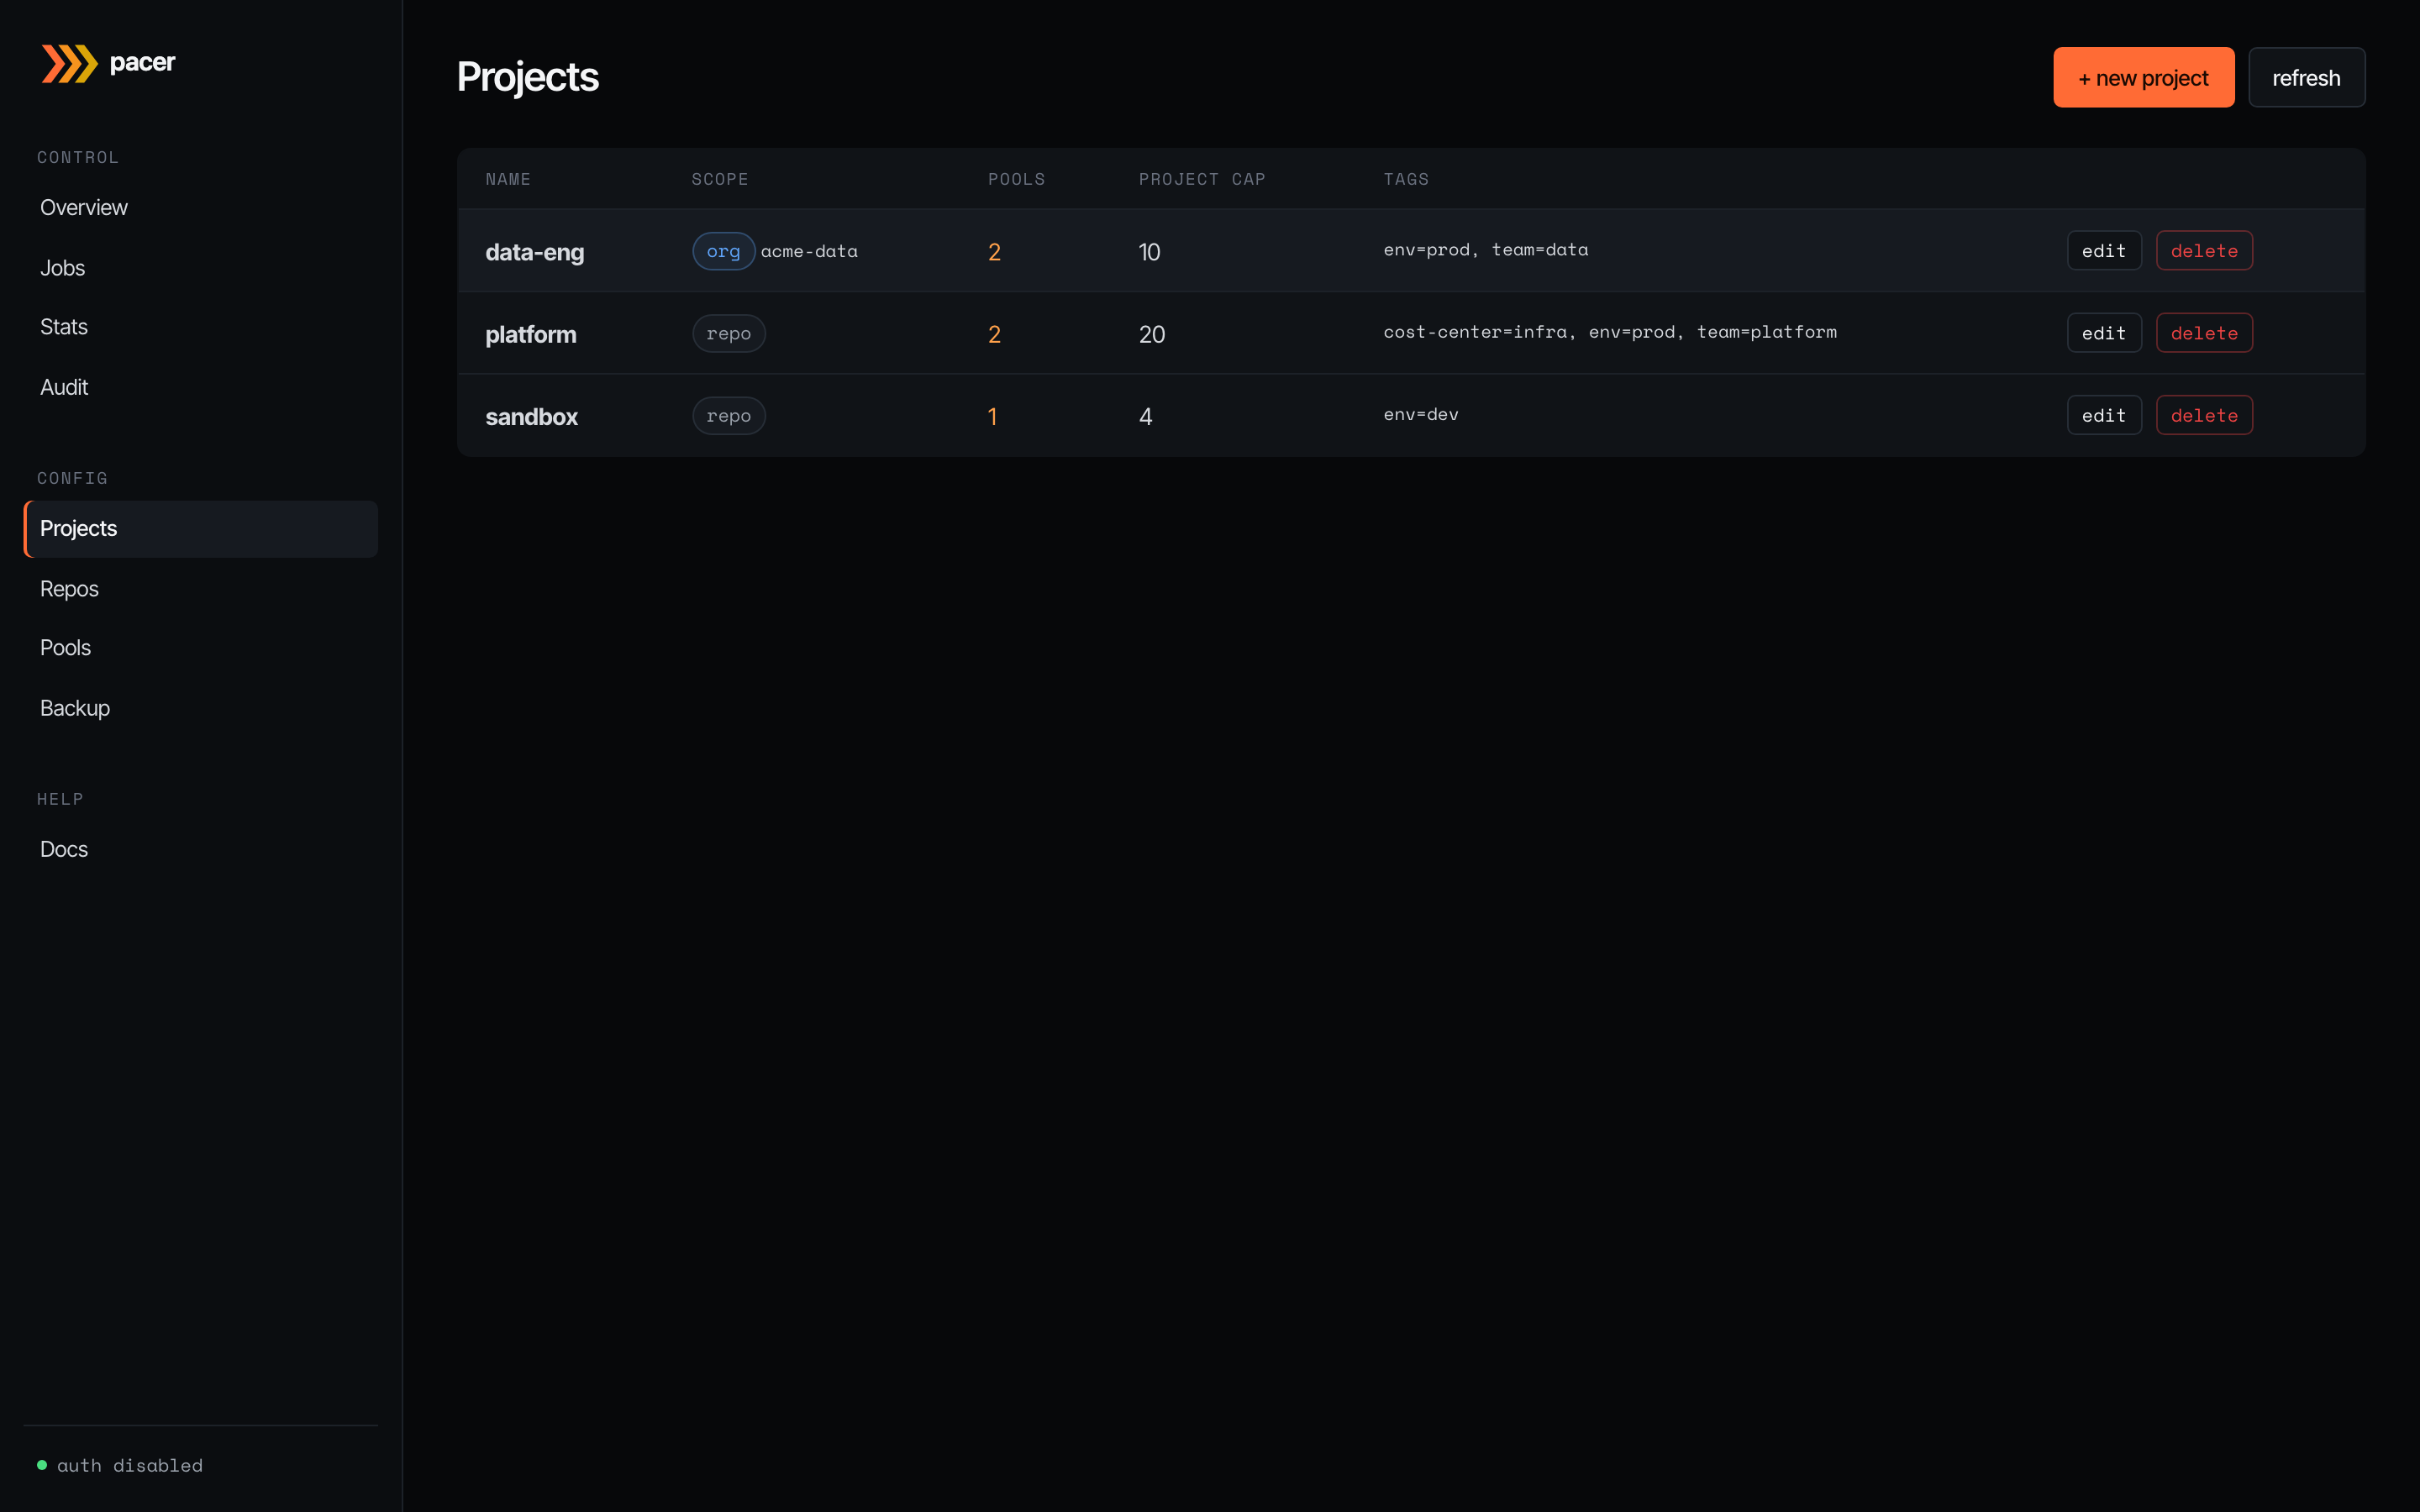
Projects are logical groupings: a name, a project-wide concurrency ceiling, cascading tags, and a disabled flag. Nothing EC2-shaped lives here — that’s pools’ job. The scope column shows how repos bind to the project: repo means individual repo bindings (the default); org means every repo under a GitHub org auto-binds.
The + new project button opens the editor:
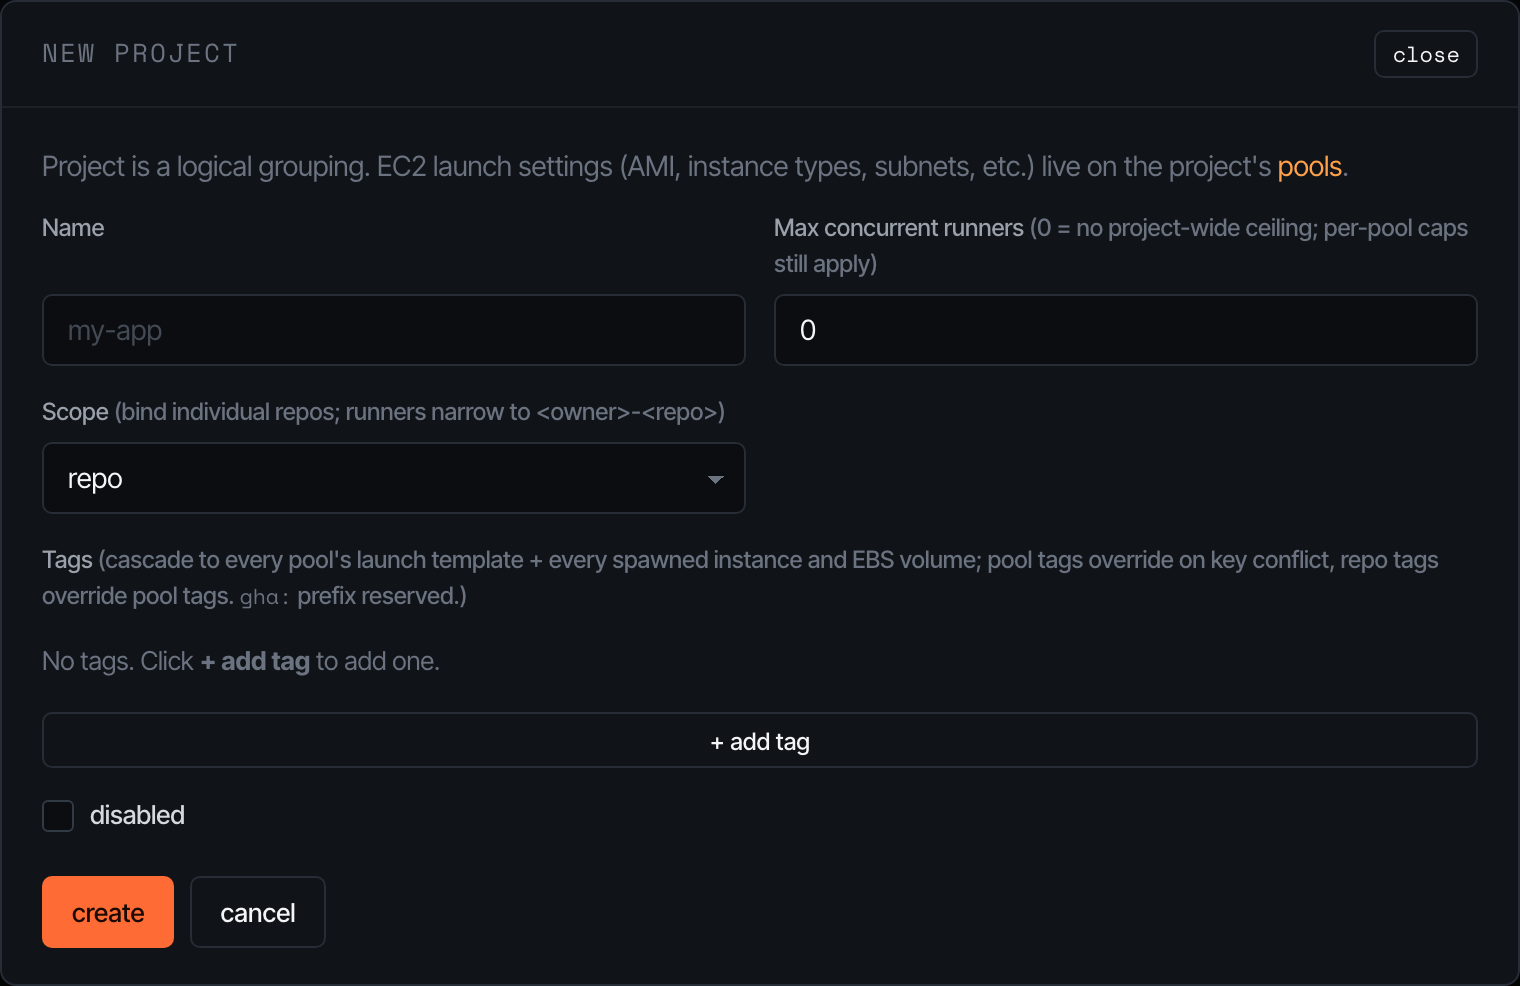
The cap field is a soft ceiling that gates the orchestrator’s claim loop — set it to 0 to disable and let per-pool caps do all the work. Tags written here cascade down to every pool’s launch template and onto every spawned instance / EBS volume; pool tags can override on key conflict, repo tags can override pool tags. The gha: prefix is reserved for Pacer-managed tags.
Repos
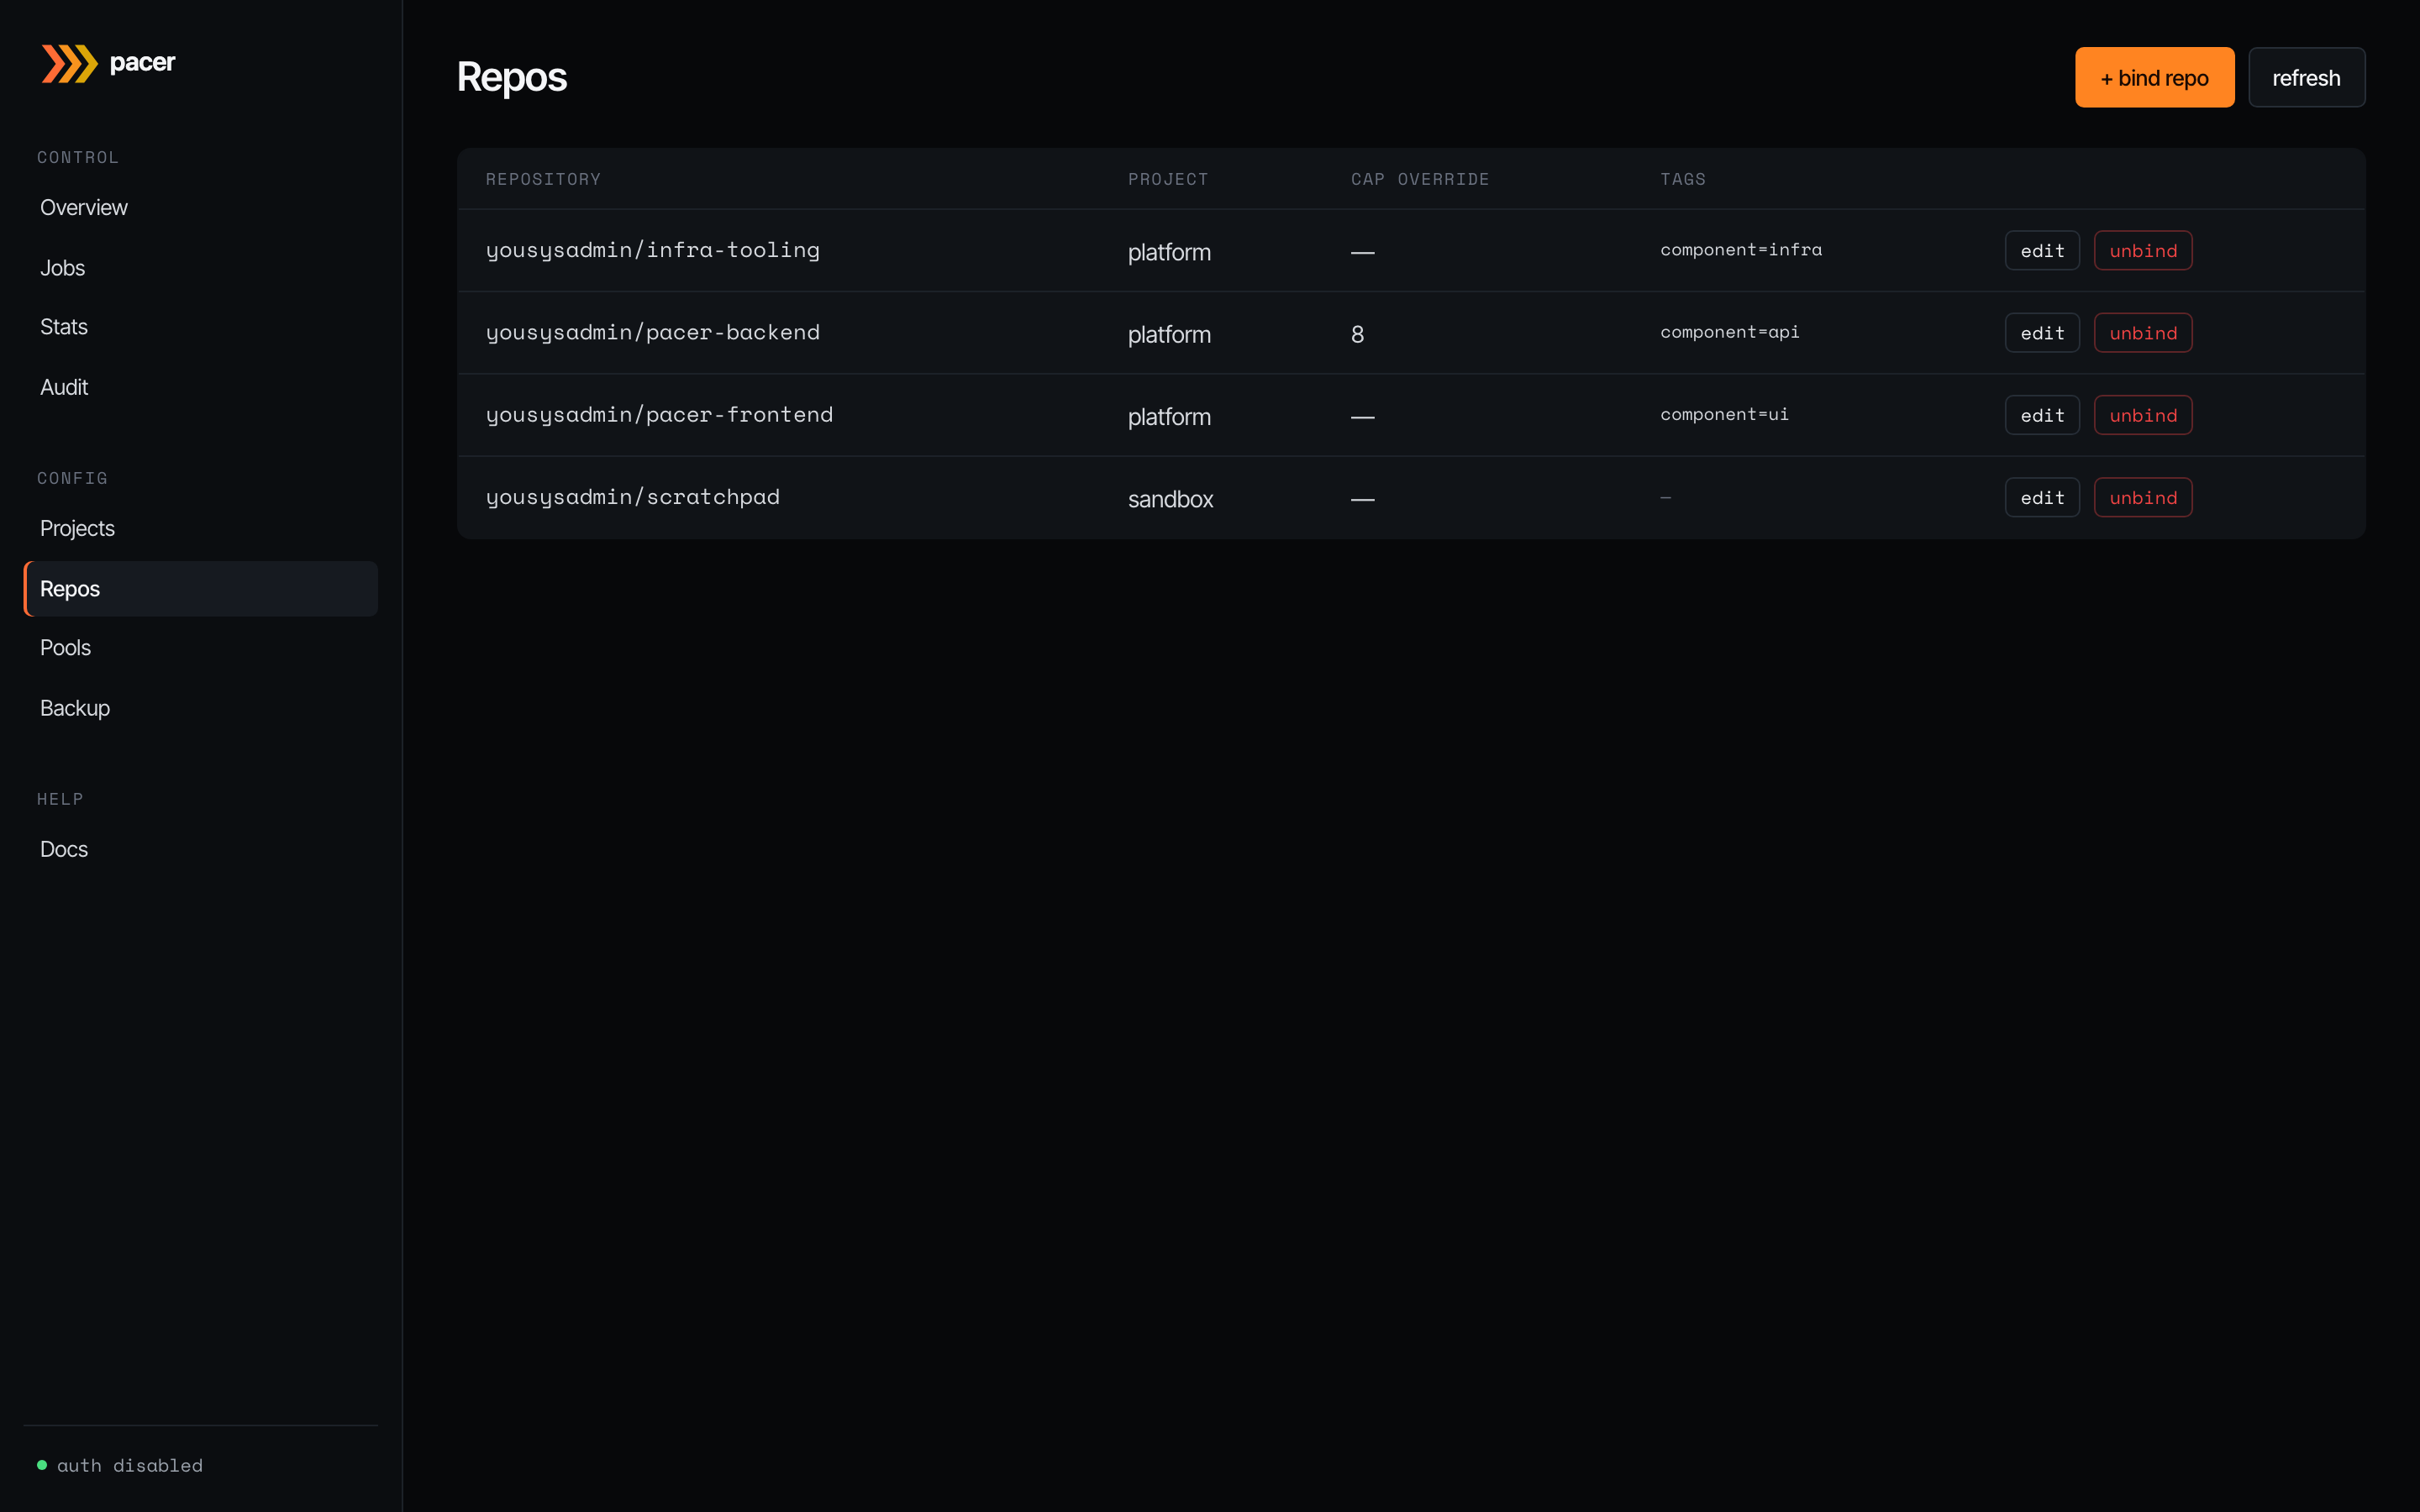
The bridge between GitHub and a project. Each row binds a <owner>/<repo> to one project, optionally overriding the project’s concurrency cap, and stamping repo-specific tags onto instances at spawn time (these don’t go on the launch template — pools are shared across repos).
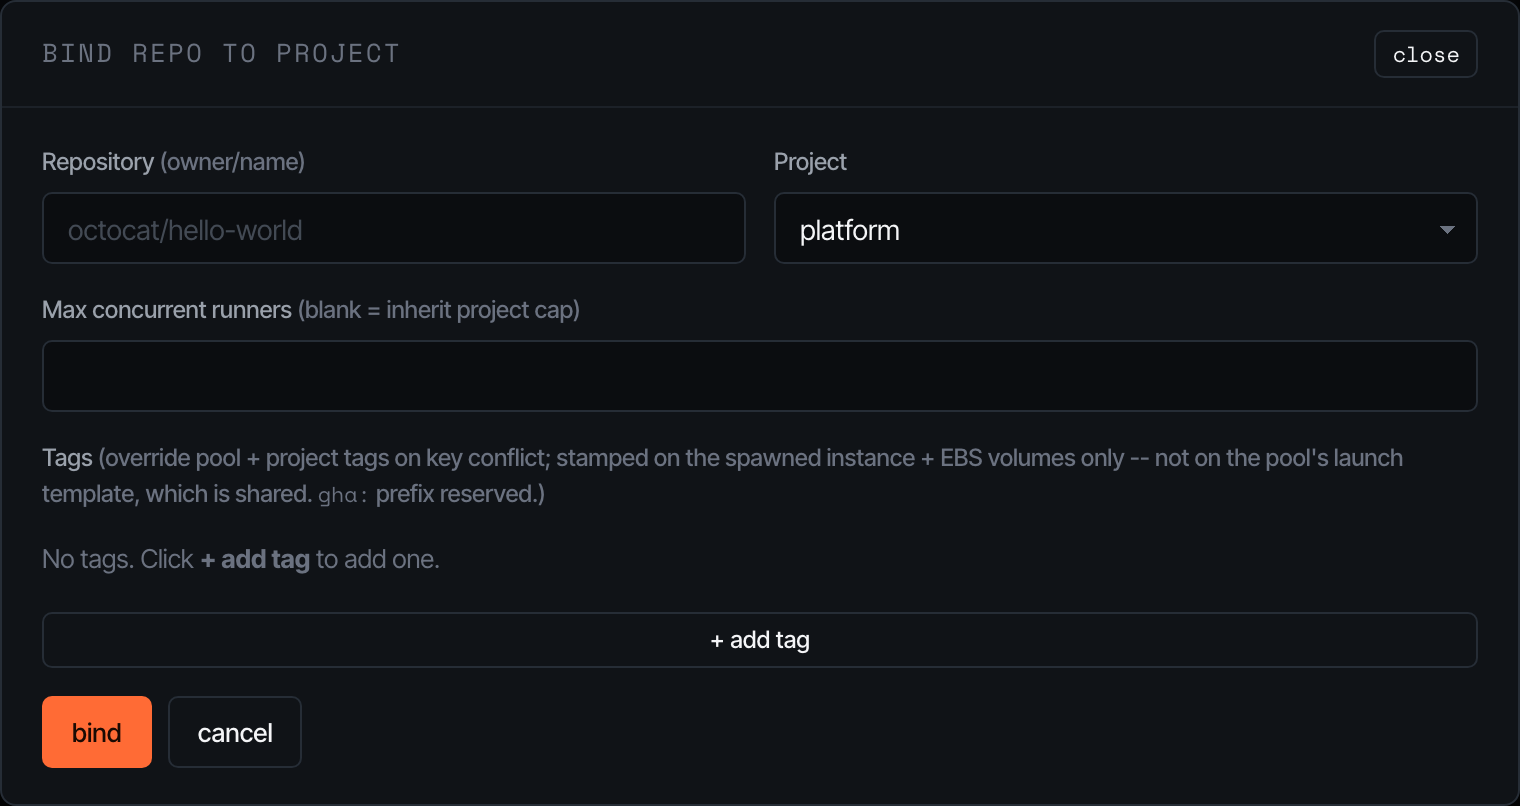
The bind modal is intentionally minimal — pick the project, paste the GitHub owner/repo, and (optionally) cap and tags. Pacer enforces 1:1 between a repo and a project.
Pools
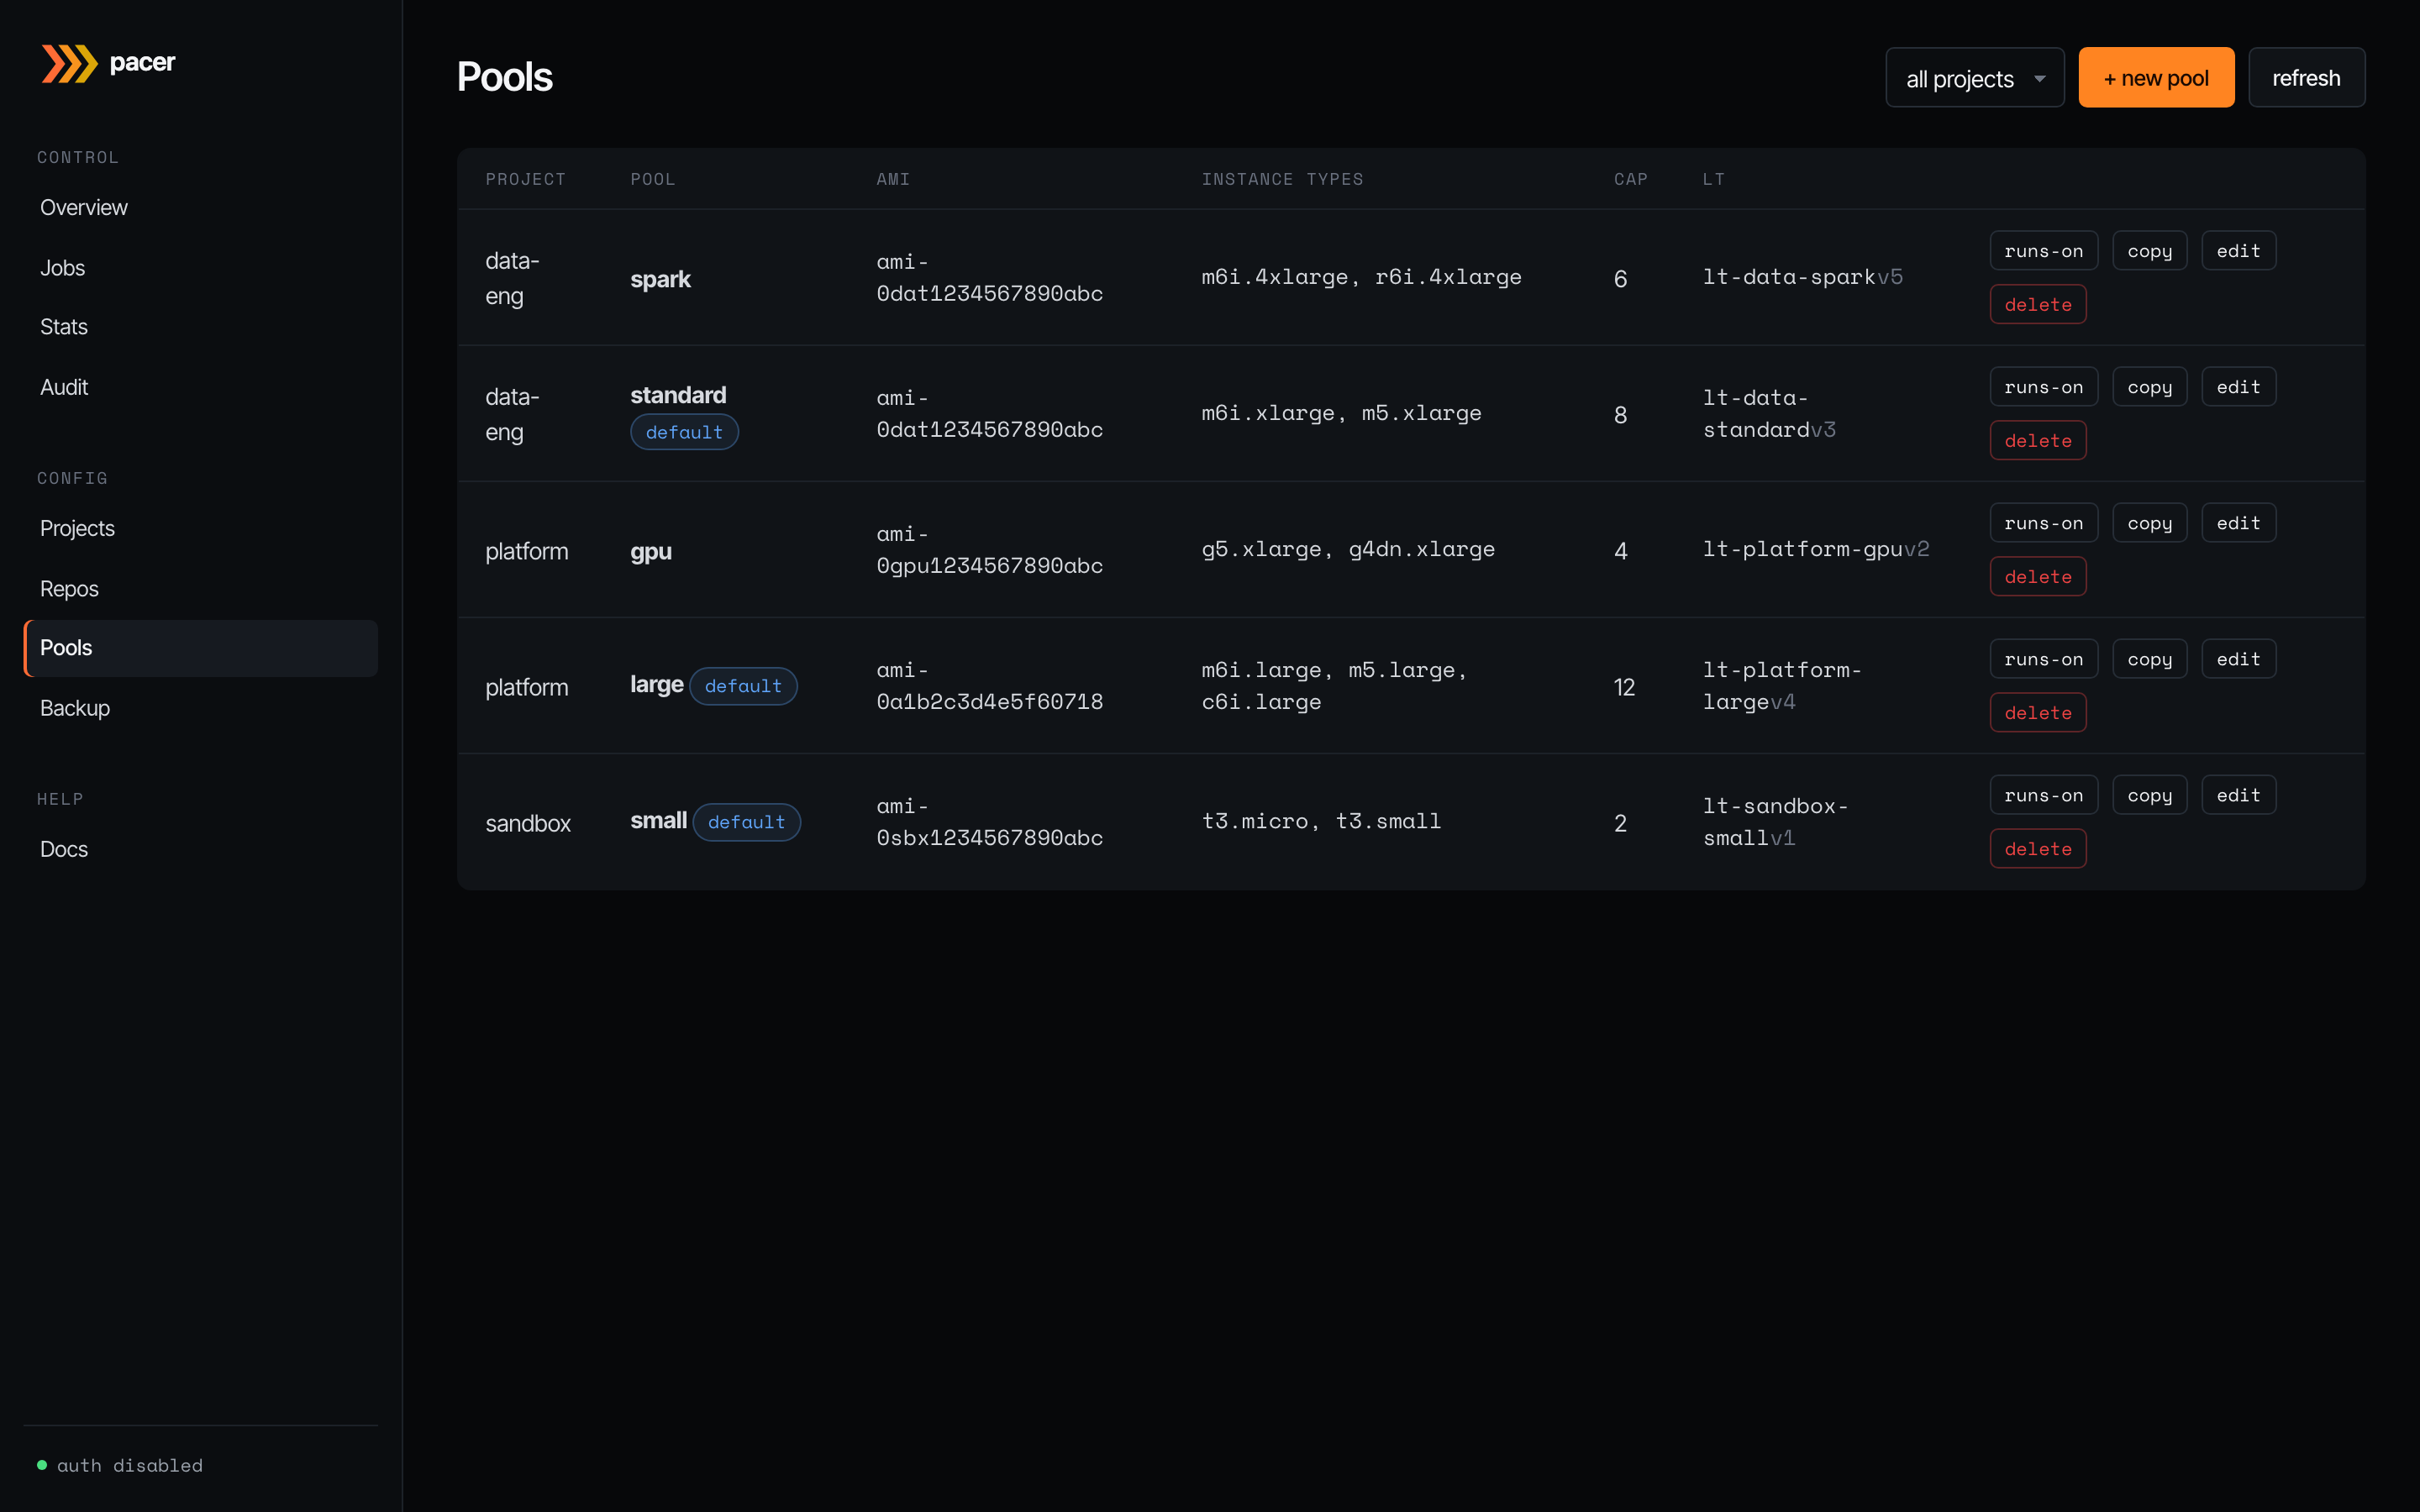
The EC2 launch-template shape. Each row is one materialised launch template: AMI, instance type list, per-pool concurrency cap, the LT ID + version Pacer assigned, and per-row buttons for runs-on (preview the runner labels GitHub workflows must use to land on this pool), copy (clone into a new pool), edit, and delete. The default badge marks the pool that catches workflows that don’t specify a pool by name.
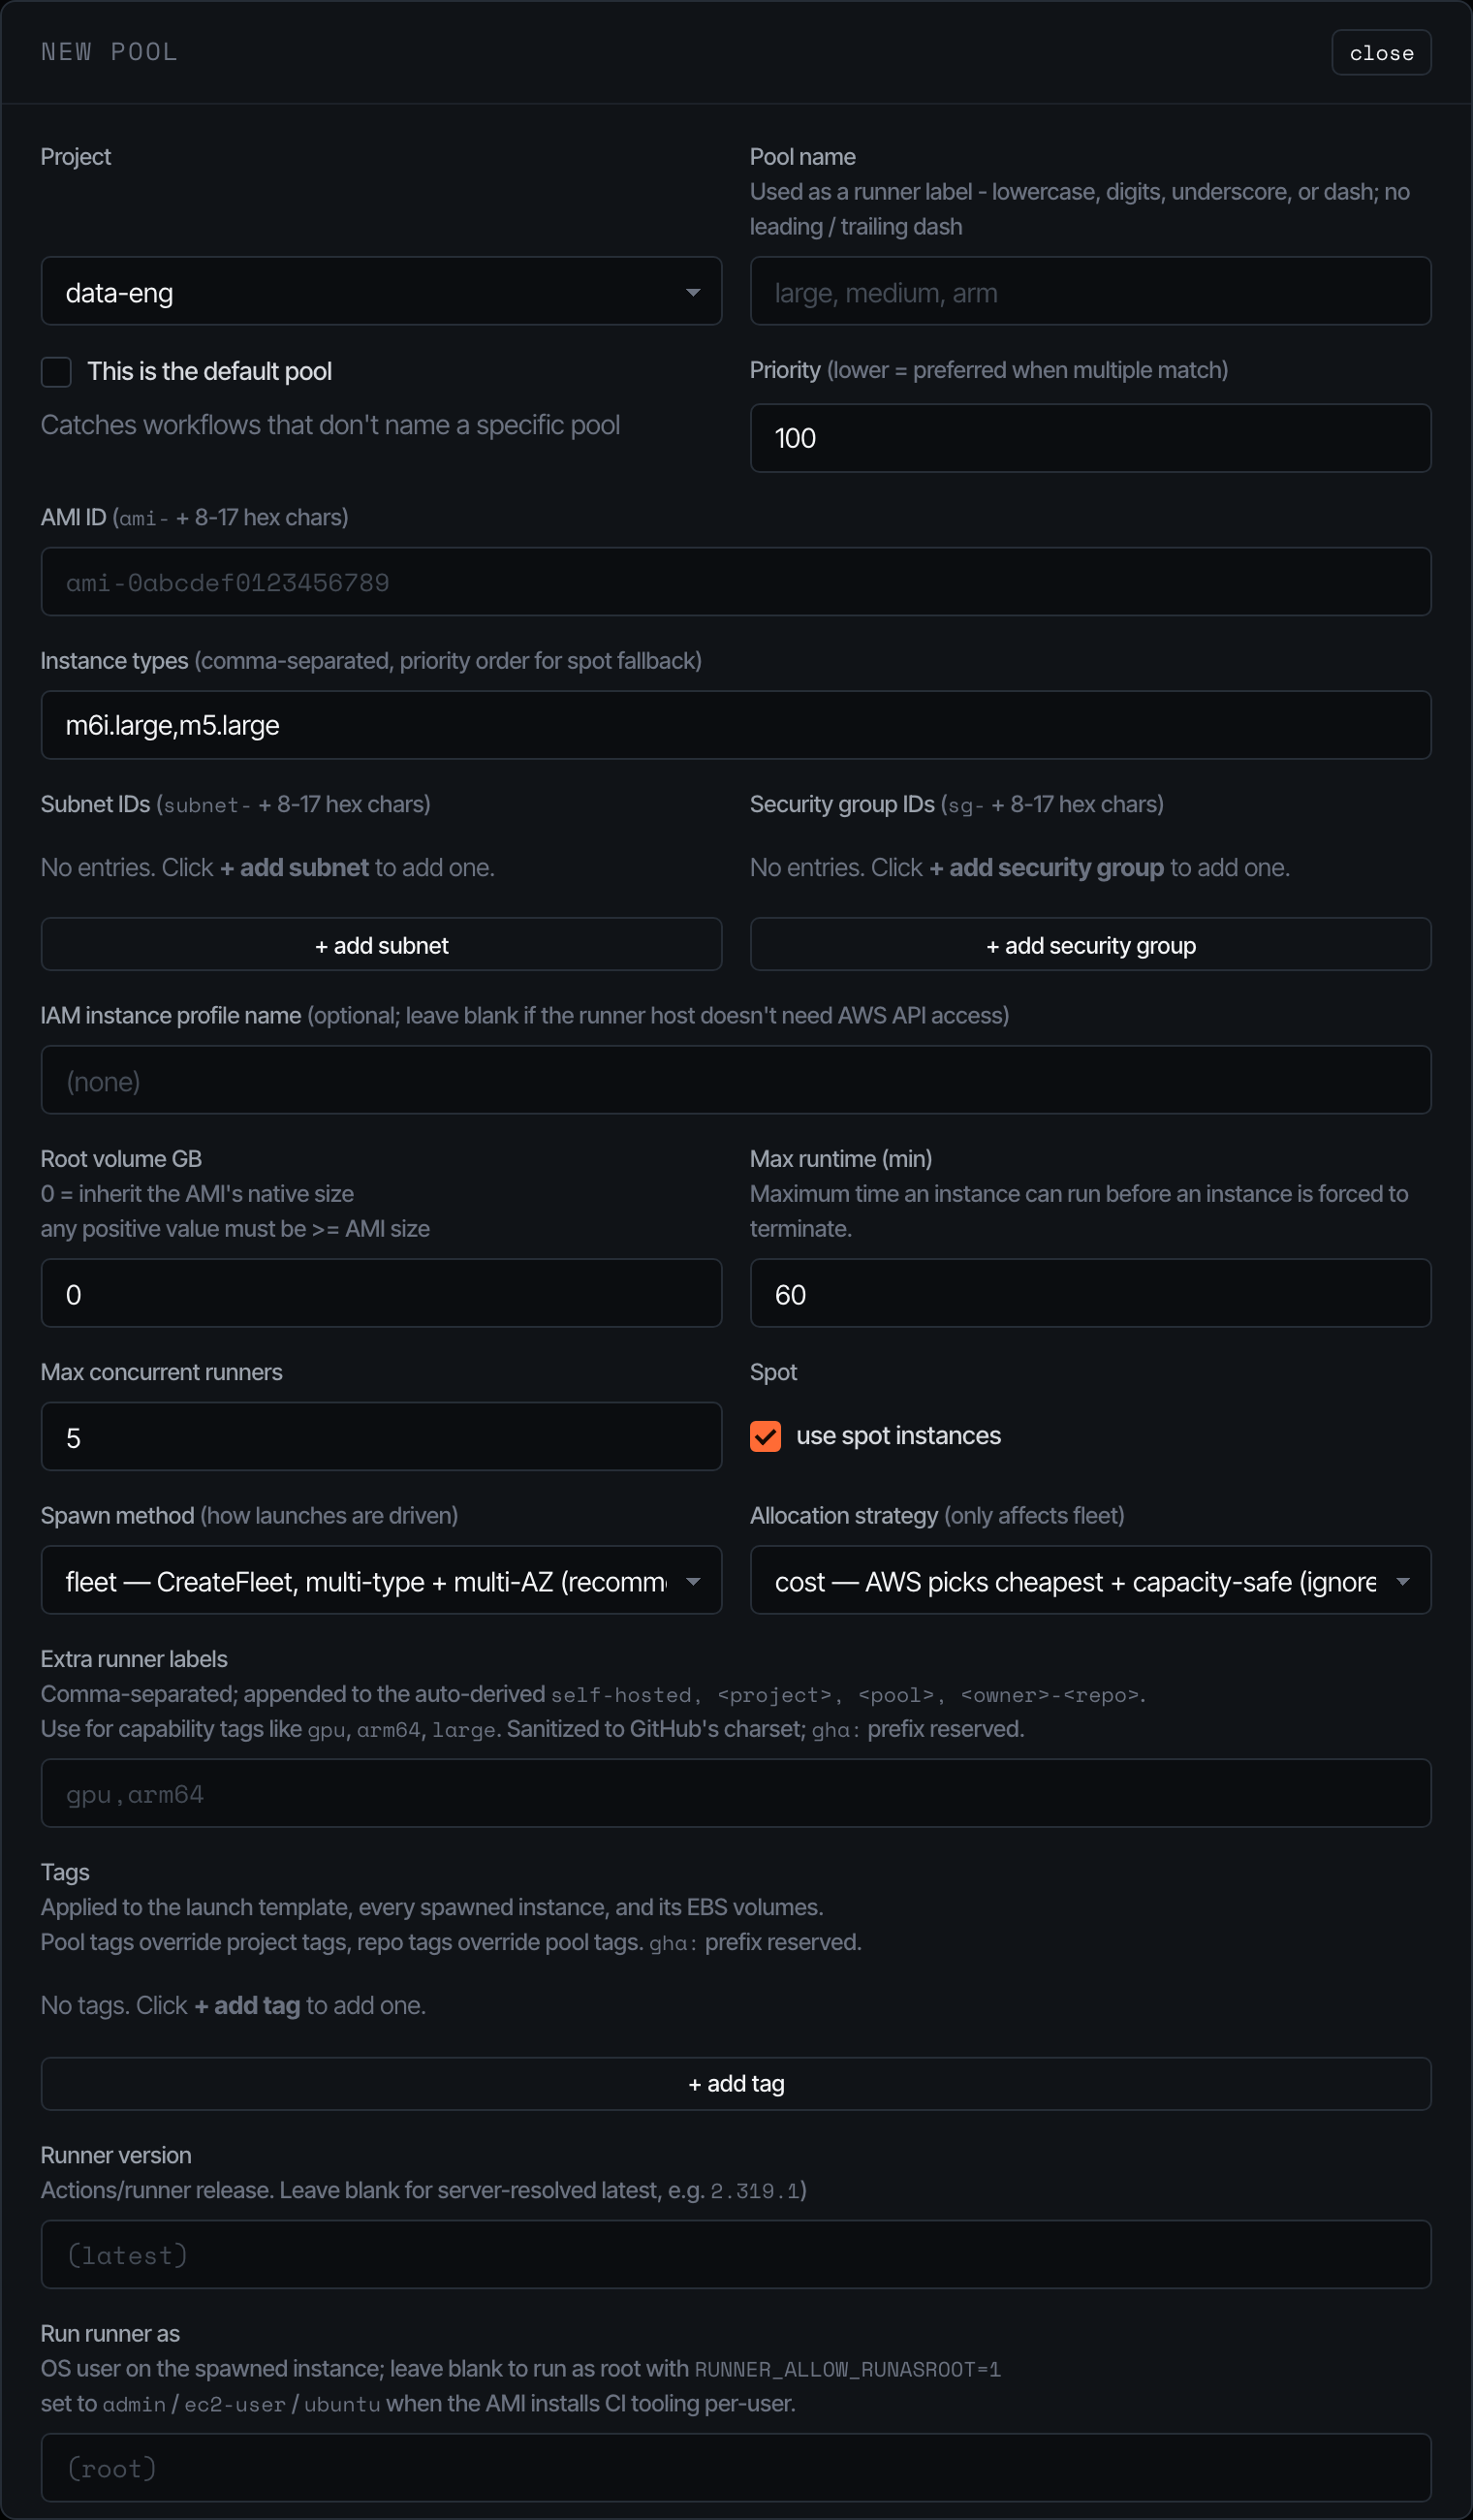
The pool editor is where most operator complexity lives:
- AMI / subnets / security groups / IAM profile — the EC2 surface; validated against the AWS account before the LT is created.
- Instance types — comma-separated, ordered. With allocation strategy = priority, this list is honoured (lowest index = highest priority). With cost (the default), AWS picks the cheapest match and ignores the order.
- Spawn method —
fleetusesCreateFleetover every (instance_type x subnet) combo (AWS picks).run_instancesis a serial fallback that only uses the first subnet. - Spot — toggles spot pricing. Capacity-aware retry (30s/60s/120s/240s/300s) handles
InsufficientInstanceCapacityand friends transparently. - Max runtime — instances exceeding this are terminated by the reaper (default 60 minutes). EBS volumes go with them —
InstanceInitiatedShutdownBehavior=terminateis set on the LT. - Extra runner labels — appended to the auto-derived
[self-hosted, <project>, <pool>, <owner>-<repo>]set. Sanitised to GitHub’s character class.
Saving a pool re-materialises the LT (creates a new version + sets it default). The LT ID is stable across pool renames.
Backup
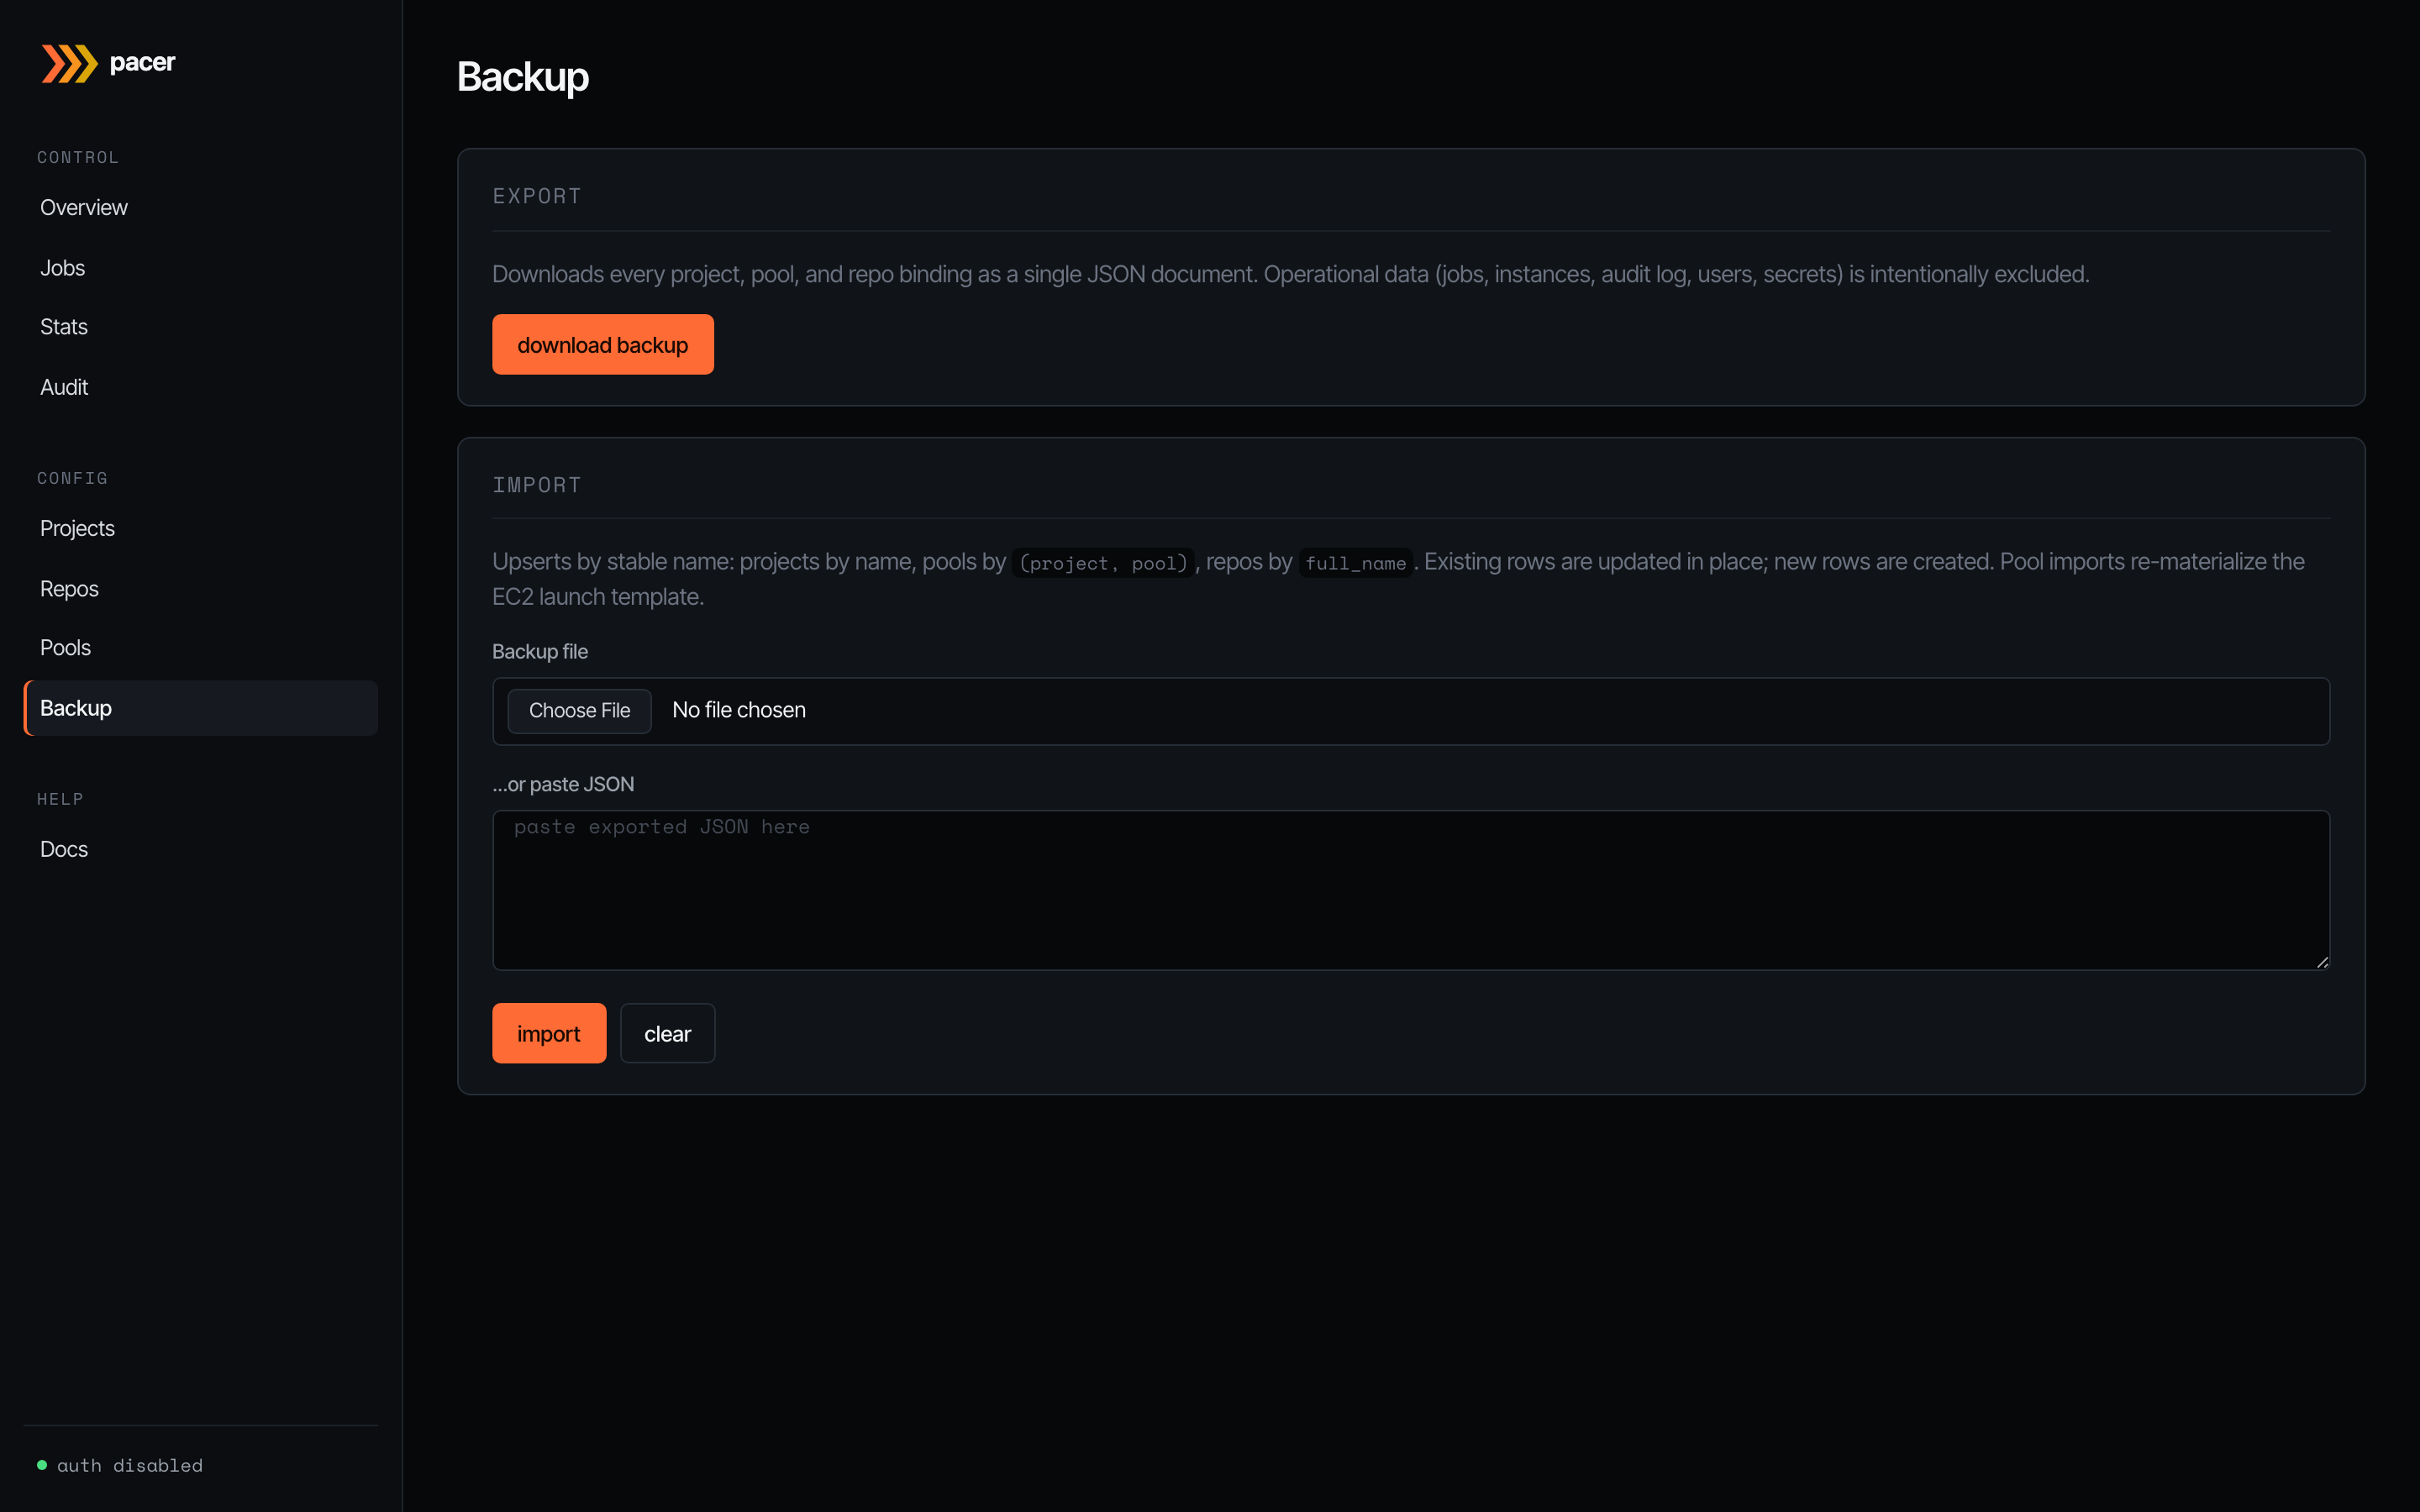
JSON export / import for the operator-edited slice of state: every project, pool, and repo binding. Operational data (jobs, instances, audit log, users, secrets) is intentionally excluded — backups are for moving config between environments, not for disaster recovery of the orchestrator’s running state.
Imports upsert by stable name: projects by name, pools by (project, pool), repos by full_name. Existing rows are updated in place; new rows are created. Pool imports re-materialise the EC2 launch template, so an import of pool config against a fresh AWS account works end-to-end (assuming the AMI / subnets / security groups exist).
Settings
Pacer-managed runtime config that lives in the database (not in YAML). Two cards:
Bootstrap API Token
The shared secret baked into every pool’s launch-template user-data. The in-instance bootstrap script presents it as Authorization: Bearer <token> when calling POST /api/runner/bootstrap to fetch its per-job callback token. The card shows a masked preview of the current value and the last rotation timestamp. Rotate generates a fresh 32-byte hex token, persists it, then re-materialises every pool’s launch template so the new token is baked into future spawns. Instances launched against an older LT version will fail to bootstrap (401 from the bootstrap endpoint) and be marked failed — drain pending jobs before rotating if you can’t tolerate that.
Log retention
How long the audit log and webhook delivery records are kept before the daily pruner deletes them. Each row carries:
- the editable value (a day count),
- the YAML default beside it (
retention.audit_days/retention.webhook_days), - an
overriddentag when the saved value differs from the YAML default, and - a use default button that clears the override and reverts to the YAML floor.
Changes are stored in the settings table and take effect at the next daily prune sweep — the pruner re-reads the effective value (DB override else YAML default) on every tick, so a Settings UI change doesn’t require a restart. For an immediate one-off cleanup, use the manual prune on the Audit page.
Valid ranges: audit 1..3650 days, webhook 1..365 days. A malformed or out-of-range DB value logs a warning and falls back to the YAML default so a typo can’t take the pruner offline.